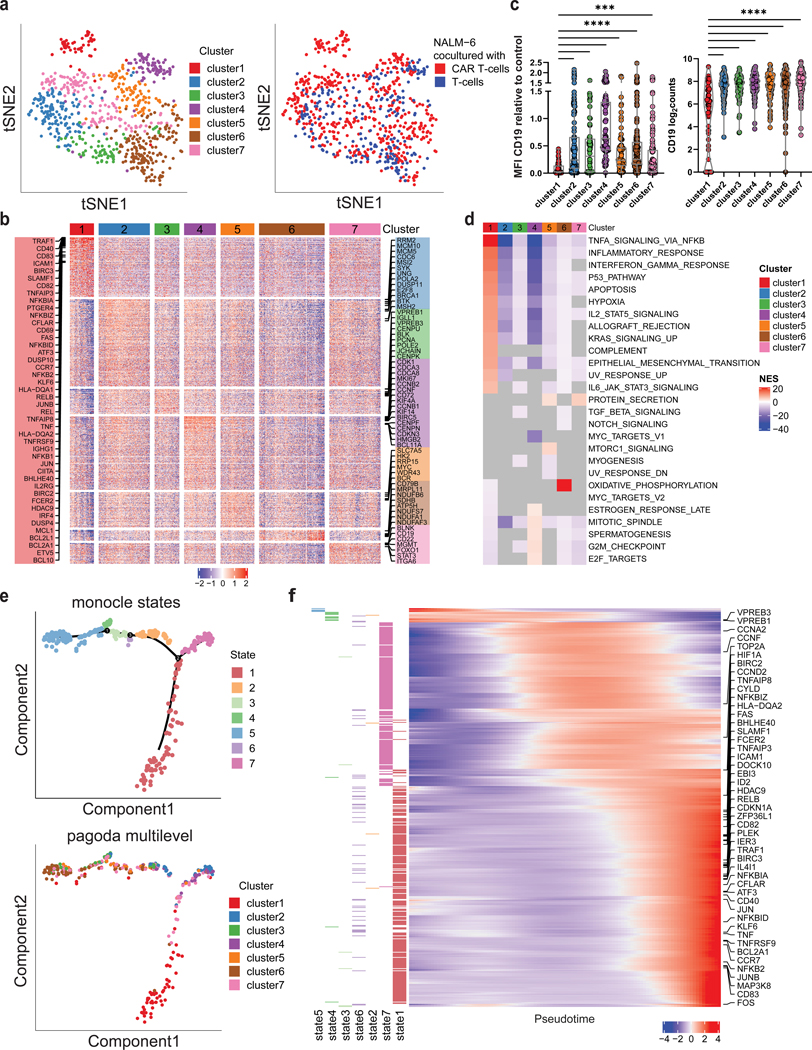
Figure 3. CD19 CAR T cells trigger activation of B-ALL cells with subsequent transcriptional rewiring.
a, ScRNA sequencing of NALM-6 B-ALL cells exposed to CD19 CAR T cells or uninfected control T cells at 5:1 ratio (E:T) for 24h. tSNE plot of B-ALL target cells showing PAGODA2 clusters (left) and type of effector cells (right). Only pagoda cluster 1 consists exclusively of B-ALL target cells exposed to CAR T cells. b, Heatmap of marker genes expressed in each PAGODA2 cluster with a mean log2FC > 1. c, CD19 surface protein (left) and mRNA (right) expression in cluster 1 cells compared to clusters 2–7 (P values determined by Dunn’s multiple comparison test. **=p<0.01, ****=p<0.0001, log2counts calculated as log2(Counts Per Million (CPM)+1)). Boxplots show minimum, 25th percentile, median, 75th percentile and maximum values. d, Heatmap of normalized enrichment scores (NES) of significantly enriched hallmark gene sets in individual clusters. Grey values depict no significance. All gene sets with a significant NES in at least one cluster are shown. e, Top, Monocle2 pseudotime analysis of B-ALL cells co-cultured with CD19 CAR T cells identifying 7 states. Bottom, projection of pagoda clusters over monocle2 pseudotime distribution. f, Heatmap of genes that informed the pseudotemporal distribution. Increasing expression of NFkB- and CD40-signaling pathway genes over pseudotime (TNFAIP8, NFKBIZ, FAS, SLAMF1, TNFAIP3, RELB, TRAF1, NFKBIA, CFLAR, CD40, NFKBID, KLF6, TNF, BCL2A1, CCR7, NFKB2) with highest enrichment in state 1. Left annotation depicts state, in which each gene is expressed at highest.

