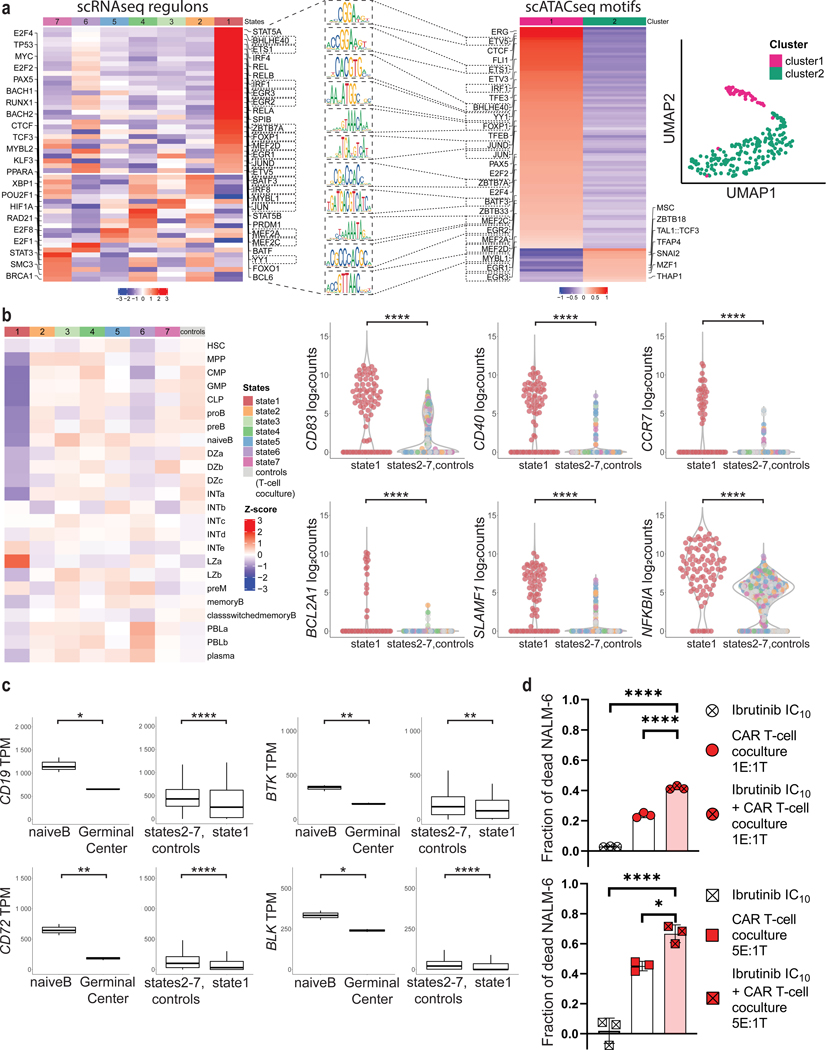
Figure 4. Interactions with CD19 CAR T cells induce germinal center reaction regulatory programs in B-ALL cells.
a, Left, activity of selected transcriptional regulons involved in B-cell lineage in NALM-6 cells, as predicted by SCENIC. Right, UMAP projection and cluster identification of scATAC-seq peaks from B-ALL cells that have been co-cultured with CAR T cells at 5:1 (E:T) ratio for 24h. Rectangular markings depict regulons and motifs that overlap in state 1 (scRNA-seq) and cluster 1 (scATAC-seq). Middle, visualization of selected motifs from overlap (significant differential accessibility of germinal center motifs in cluster 1 was tested by Fisher’s exact test (p=0.0003)). b, Left, heatmap demonstrating expression of HSC, MPP, CLP, proB, preB, naïveB, Germinal Center (GC) Dark Zone, GC Intermediate Zone, GC Light Zone, preMemory, Memory, class-switched Memory, Plasmablast, Plasma cell - signatures in monocle2 states of NALM-6 cells exposed to CAR T cells and uninfected T cells (controls). Right, violin plots of selected germinal center light zone gene expressions CD83, CD40, CCR7, BCL2A1, SLAMF1 and NFKBIA from monocle state 1 compared with states 2–7 and NALM-6 exposed to uninfected T cells (controls). Log2counts calculated as log2 (Counts Per Million (CPM)+1). c, Violin plots displaying lower CD19, BTK, BLK and CD72 expression (Transcripts Per Kilobase Million (TPM)) in germinal center B cells compared to naïve B cells in previously published dataset from Holmes et al. [33] (left panels), and B-ALL cells from monocle state 1 compared with states 2–7 and NALM-6 exposed to uninfected T cells (right panels). Boxplots show minimum, 25th percentile, median, 75th percentile and maximum values. d, Cytotoxicity of CD19 CAR T cells in the presence of ibrutinib at IC10 concentration of 0.963μM after 6h of co-culture with NALM-6 cells (percentages of dead cells normalized to baseline cytotoxicity of uninfected T-cells. P values determined by Tukey’s multiple comparisons test, n=3, representative of two independent experiments using either CAR constructs 1 or 2, respectively. *=p<0.05, ****=p<0.0001. Data are mean ± s.d.).

