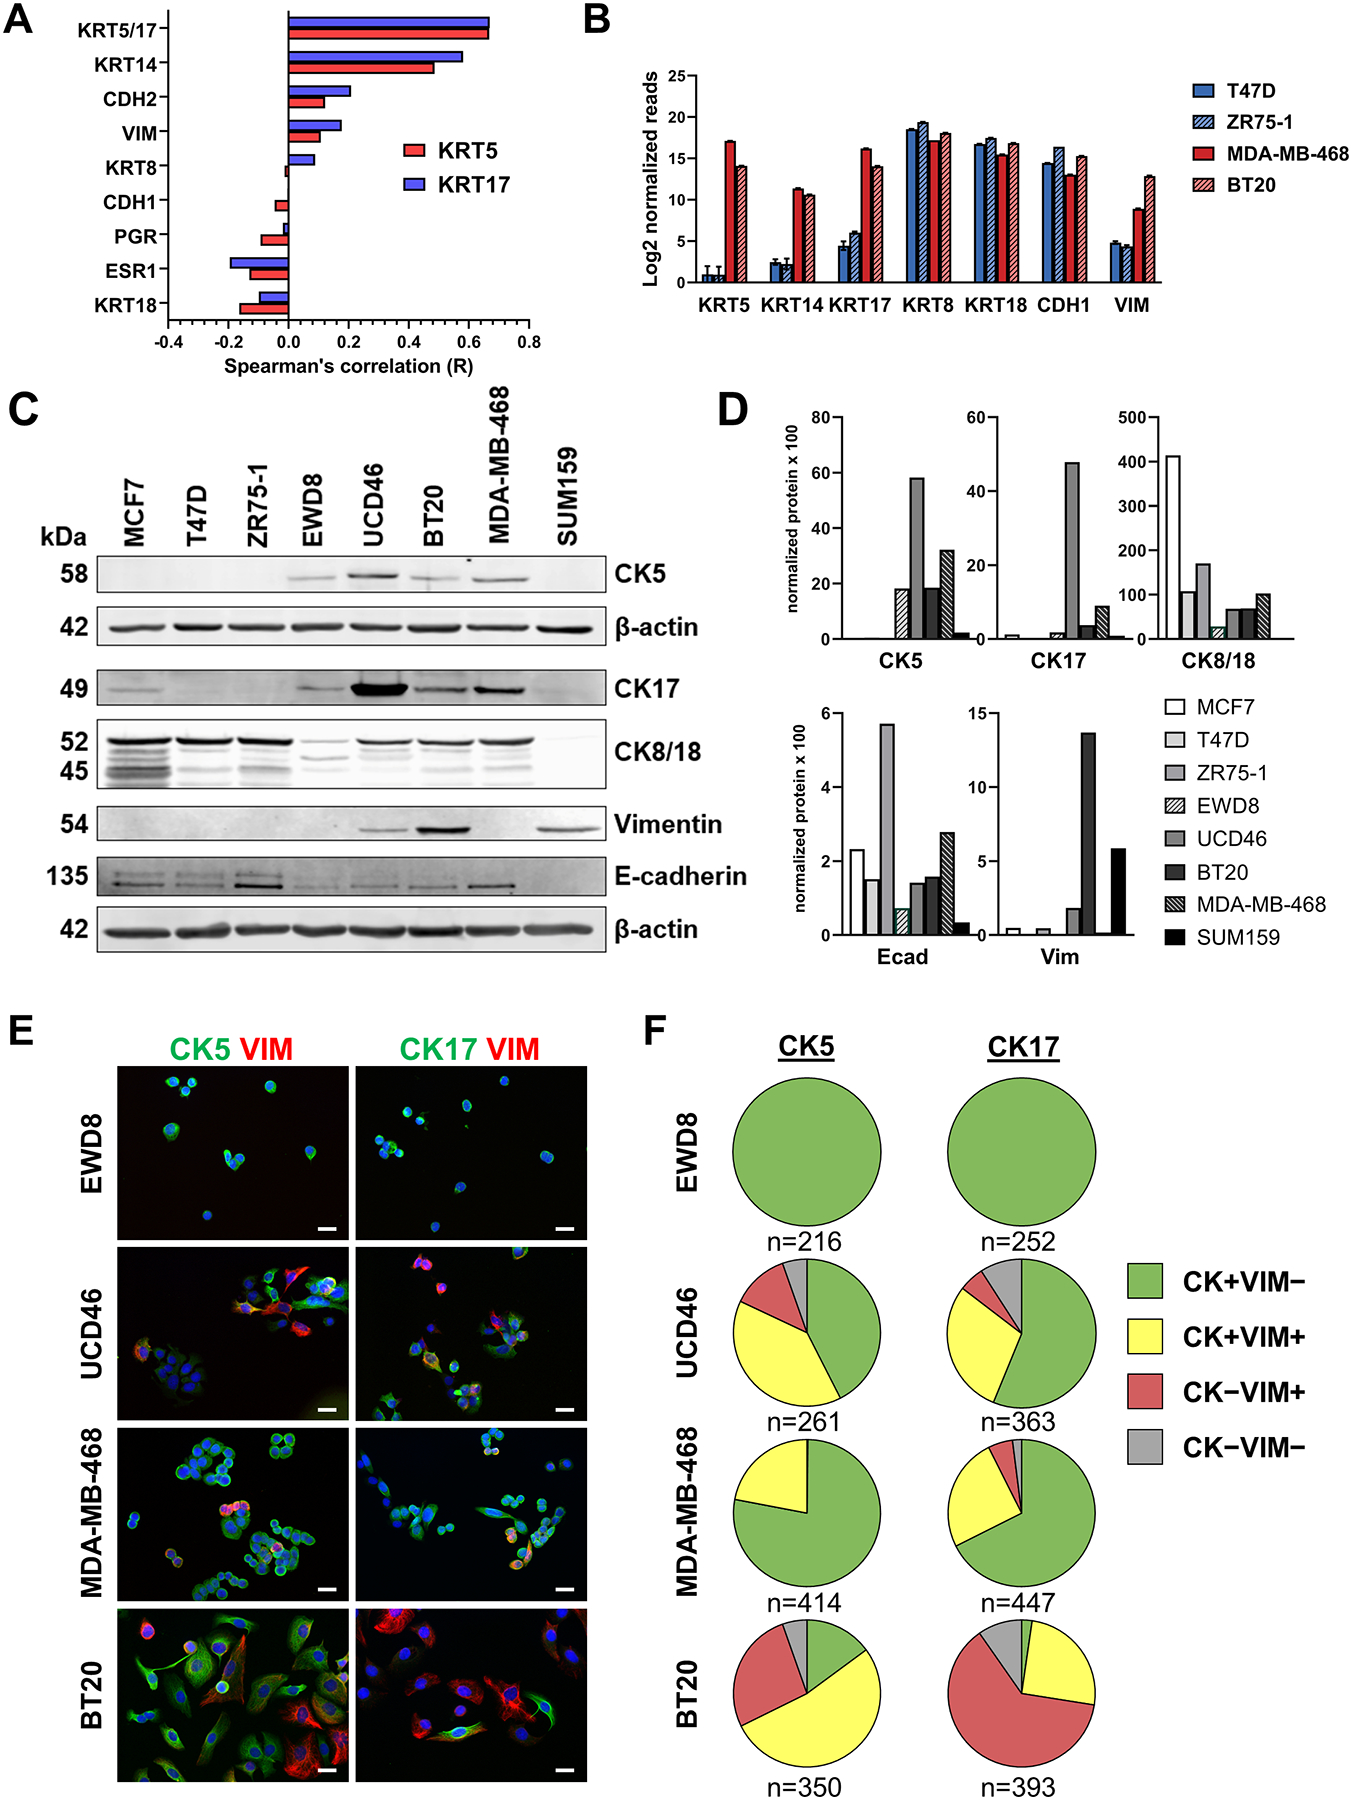
Figure 1. BLBC cell lines contain heterogeneous expression of basal CKs and vimentin.

A. Spearman correlation coefficients for KRT5 (red bars) and KRT17 (blue bars) for the indicated genes derived from mRNA expression data for The Cancer Genome Atlas (TCGA, cbioportal) for 307 TNBCs. B. Log2 normalized mRNA expression of the indicated 7 genes from RNA-seq data of two ER+ (T47D, ZR75–1) and two BLBC (MDA-MB-468, BT20) cell lines. C. Cell lysates were collected from the indicated 8 cell lines and analyzed by immunoblot for the indicated proteins. β-actin was used as a loading control. CK5 was run on a separate blot. D. Protein levels were normalized to β-actin by densitometry and individually plotted as arbitrary units (AU) times 100. E. Dual-fluorescent ICC for CK5 (green) or CK17 (green) and vimentin (VIM, red), plus DAPI (blue) counterstain in luminal-basal cell line EWD8 and BLBC cell lines UCD46, MDA-MB-468, and BT20. Scale bars, 20 μm. F. Pie charts indicating the proportion of cells that are positive for CK5 (left) or CK17 (right) only (green), VIM only (red), CK5/17 plus VIM (yellow), or none (gray) for the four cell lines. Number of cells counted is indicated.
