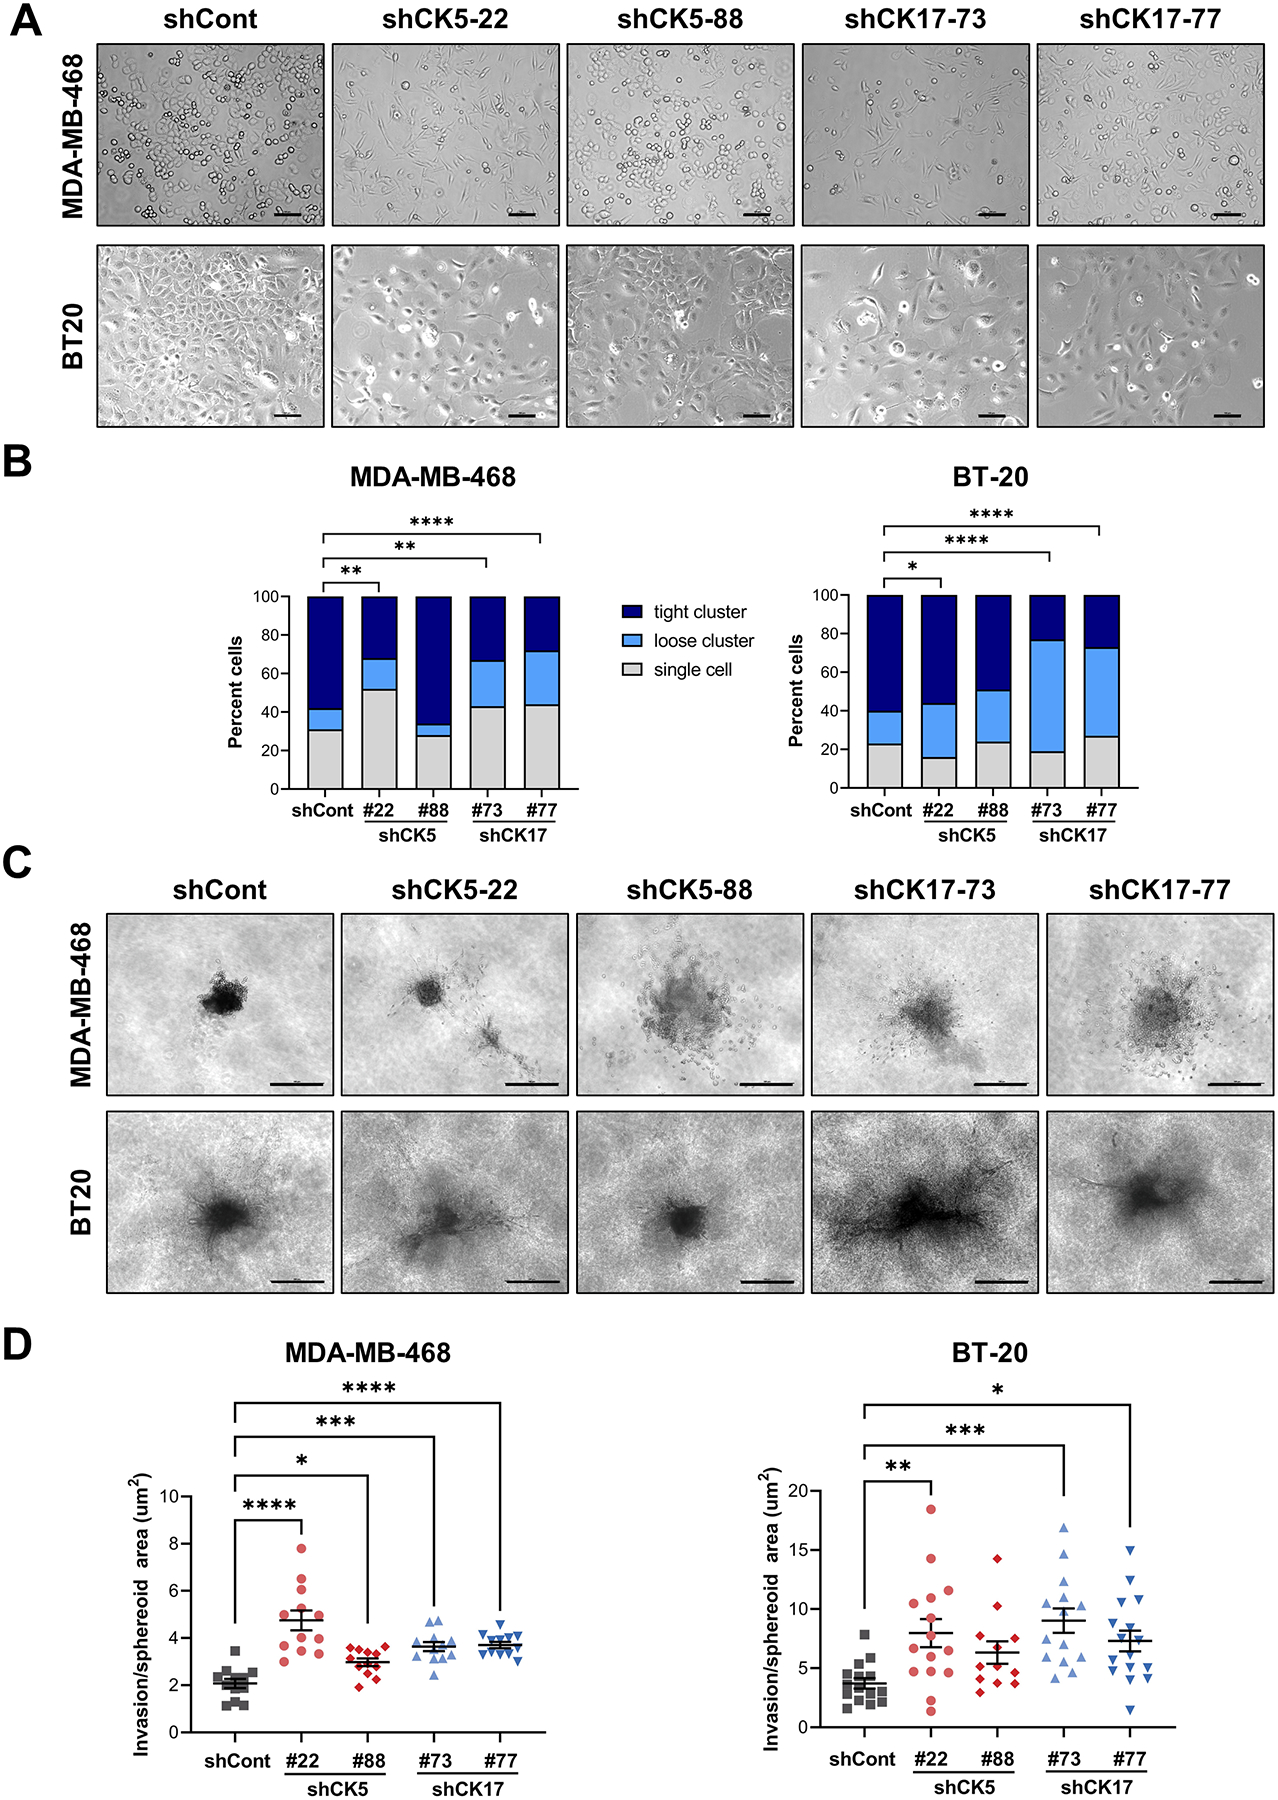
Figure 3. Knockdown of CK5 or 17 increases mesenchymal morphology and behavior of BLBC cells.

A. Bright-field images of MDA-MB-468 (top) and BT20 (bottom) cells with stable shCont or two constructs of shCK5 and shCK17. Scale bars, 100 μm. B. Cell scatter was measured by counting the number of single cells, loose clusters (2–10 cells), and tight clusters (>10 cells) in five bright-field images. The number of counted events ranged from 81–126 in MDA-MB-468 and 60–100 in BT20. The percent of cells in each category is graphed. Chi-square tests of contingency tables comparing each shRNA construct to shCont are indicated. C. Invasion was measured using a spheroid invasion assay. Spheroids were generated from the indicated cell lines on a Collagen I matrix for five days. Representative images are shown. Scale bars, 500 μm. D. The spheroid core and invasion area were measured using NIS-Elements AR analysis software and plotted as invasion/spheroid area. Bars represent mean ± SEM. One-way ANOVA/Dunnett’s test compared to shCont was used to determine statistical significance. N=12–15/group. *P<0.05, **P<0.01, ***P<0.001, ****P<0.0001.
