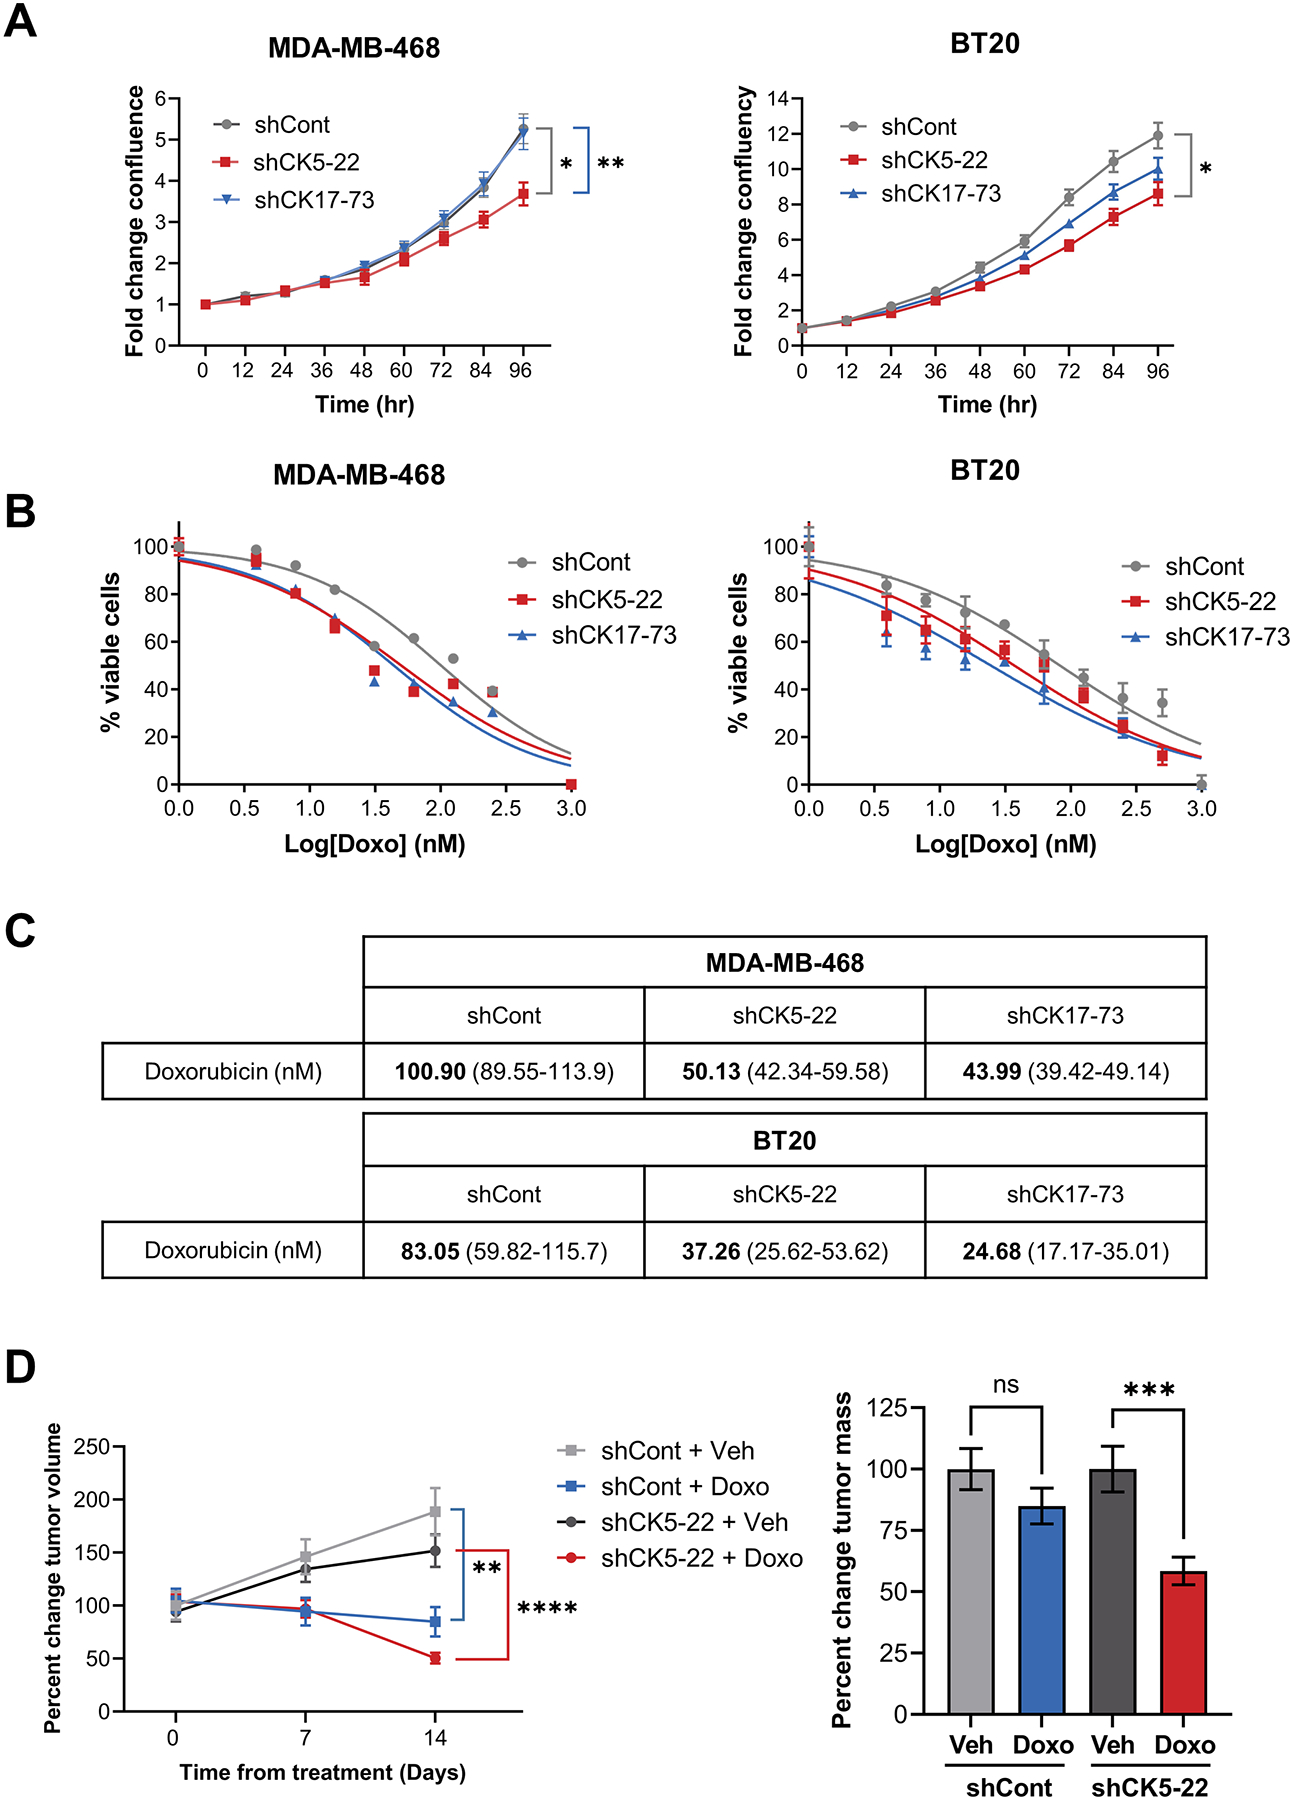
Figure 5. Loss of basal CKs increases chemosensitivity to doxorubicin.

A. Growth of shCont, sh-CK5-22, and shCK17-73 MDA-MB-468 (left) and BT20 (right) cells was measured over time using the IncuCyte. Significant differences are indicated for the final timepoint, two-way repeated measures ANOVA, N=6/group. B. The indicated cell lines were treated with varying concentrations of doxorubicin (Doxo) (B) in sextuplicate and growth monitored using the IncuCyte. Normalized transformed graphs are plotted for percent cell viability vs Log(conc) drug at 72 h. Error bars represent mean ± SEM. Experiments was repeated twice, representative graphs are shown. C. Table shows IC50 values for doxorubicin in the indicated cell lines. 95% confidence intervals are shown in parentheses. D. MDA-MB-468 shCont and shCK5 tumors were grown until an average volume of 450–500 mm3, stratified into treatment groups of vehicle (Veh) or Doxo for two weeks. Mean changes in tumor volume from time zero (left) and percent change in final tumor mass normalizing the Doxo groups to their corresponding vehicle group post-treatment (right) are plotted. T-tests at the final timepoint are indicated comparing Veh vs Doxo. N=14 for shCont tumors and N=16 for shCK5-22 tumors.
