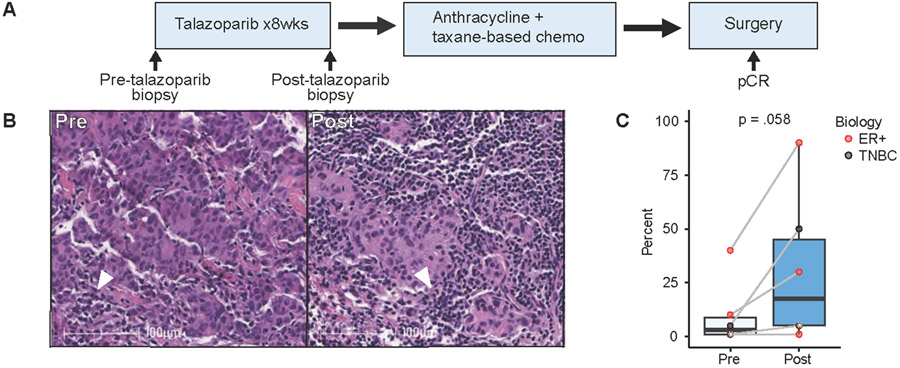
Figure 1:
Tumor-infiltrating lymphocyte variation before and after neoadjuvant talazoparib. A) Schema of study analysis. B) Representative TILs by H&E in pre- and post-talazoparib specimens. Arrowhead depicts TILs surrounded by invasive breast ductal carcinoma. Scale bar, 100 μM. C) Percentage of TILs in paired pre- and post-talazoparib specimens (n=6). Bars, boxes, and whiskers represent median, interquartile range, and range, respectively. Individual data points are shown and color encodes underlying biology with endocrine receptor (ER+) (red) or triple negative breast cancer (TNBC) (black). Data points with a white asterix in the center represents two paired specimens with overlapping values.

