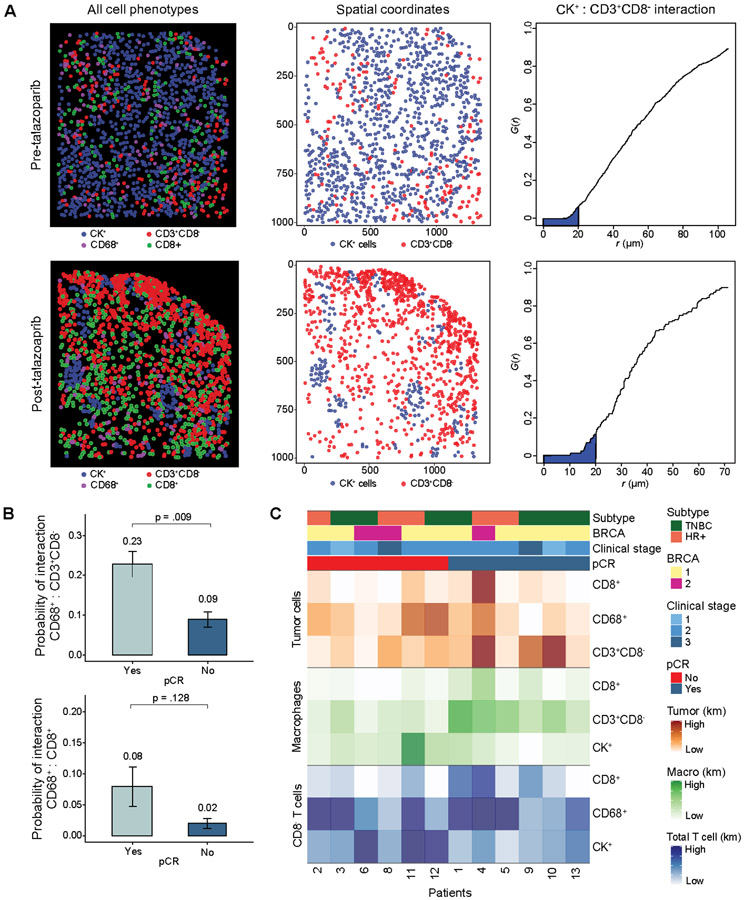
Figure 3.
Multiplex immunofluorescence spatial analysis. A) Representative spatial analysis in a paired pre-talazoparib specimens with low T cell infiltration (upper panel, low AUC) and a post-talazoparib specimen with high T cell infiltration (lower panel, high AUC). Spatial analysis of mIF data report of all pseudocolored cell types (left); tumor cells and total T cell X- and Y-spatial coordinate plots (middle); and G(r) function versus r (μm) plots with Kaplan Meier (km) estimate of AUC with radius 0-20μm (shaded blue) of tumor cell and cytotoxic T cell interaction (right). B) Pre-talazoparib G-function analysis probability of interaction between macrophages onto CD8− T cells (upper panel) and macrophages onto cytotoxic T cells (lower panel) stratified by pCR (pCR Yes, n=6, pCR No, n=6). C) Heatmap of probability of pre-talazoparib spatial interactions between each cell phenotype, grouped by pCR. Km: Kaplan Meier estimate of AUC with darker shading representing higher probability of interaction between two cell phenotypes.

