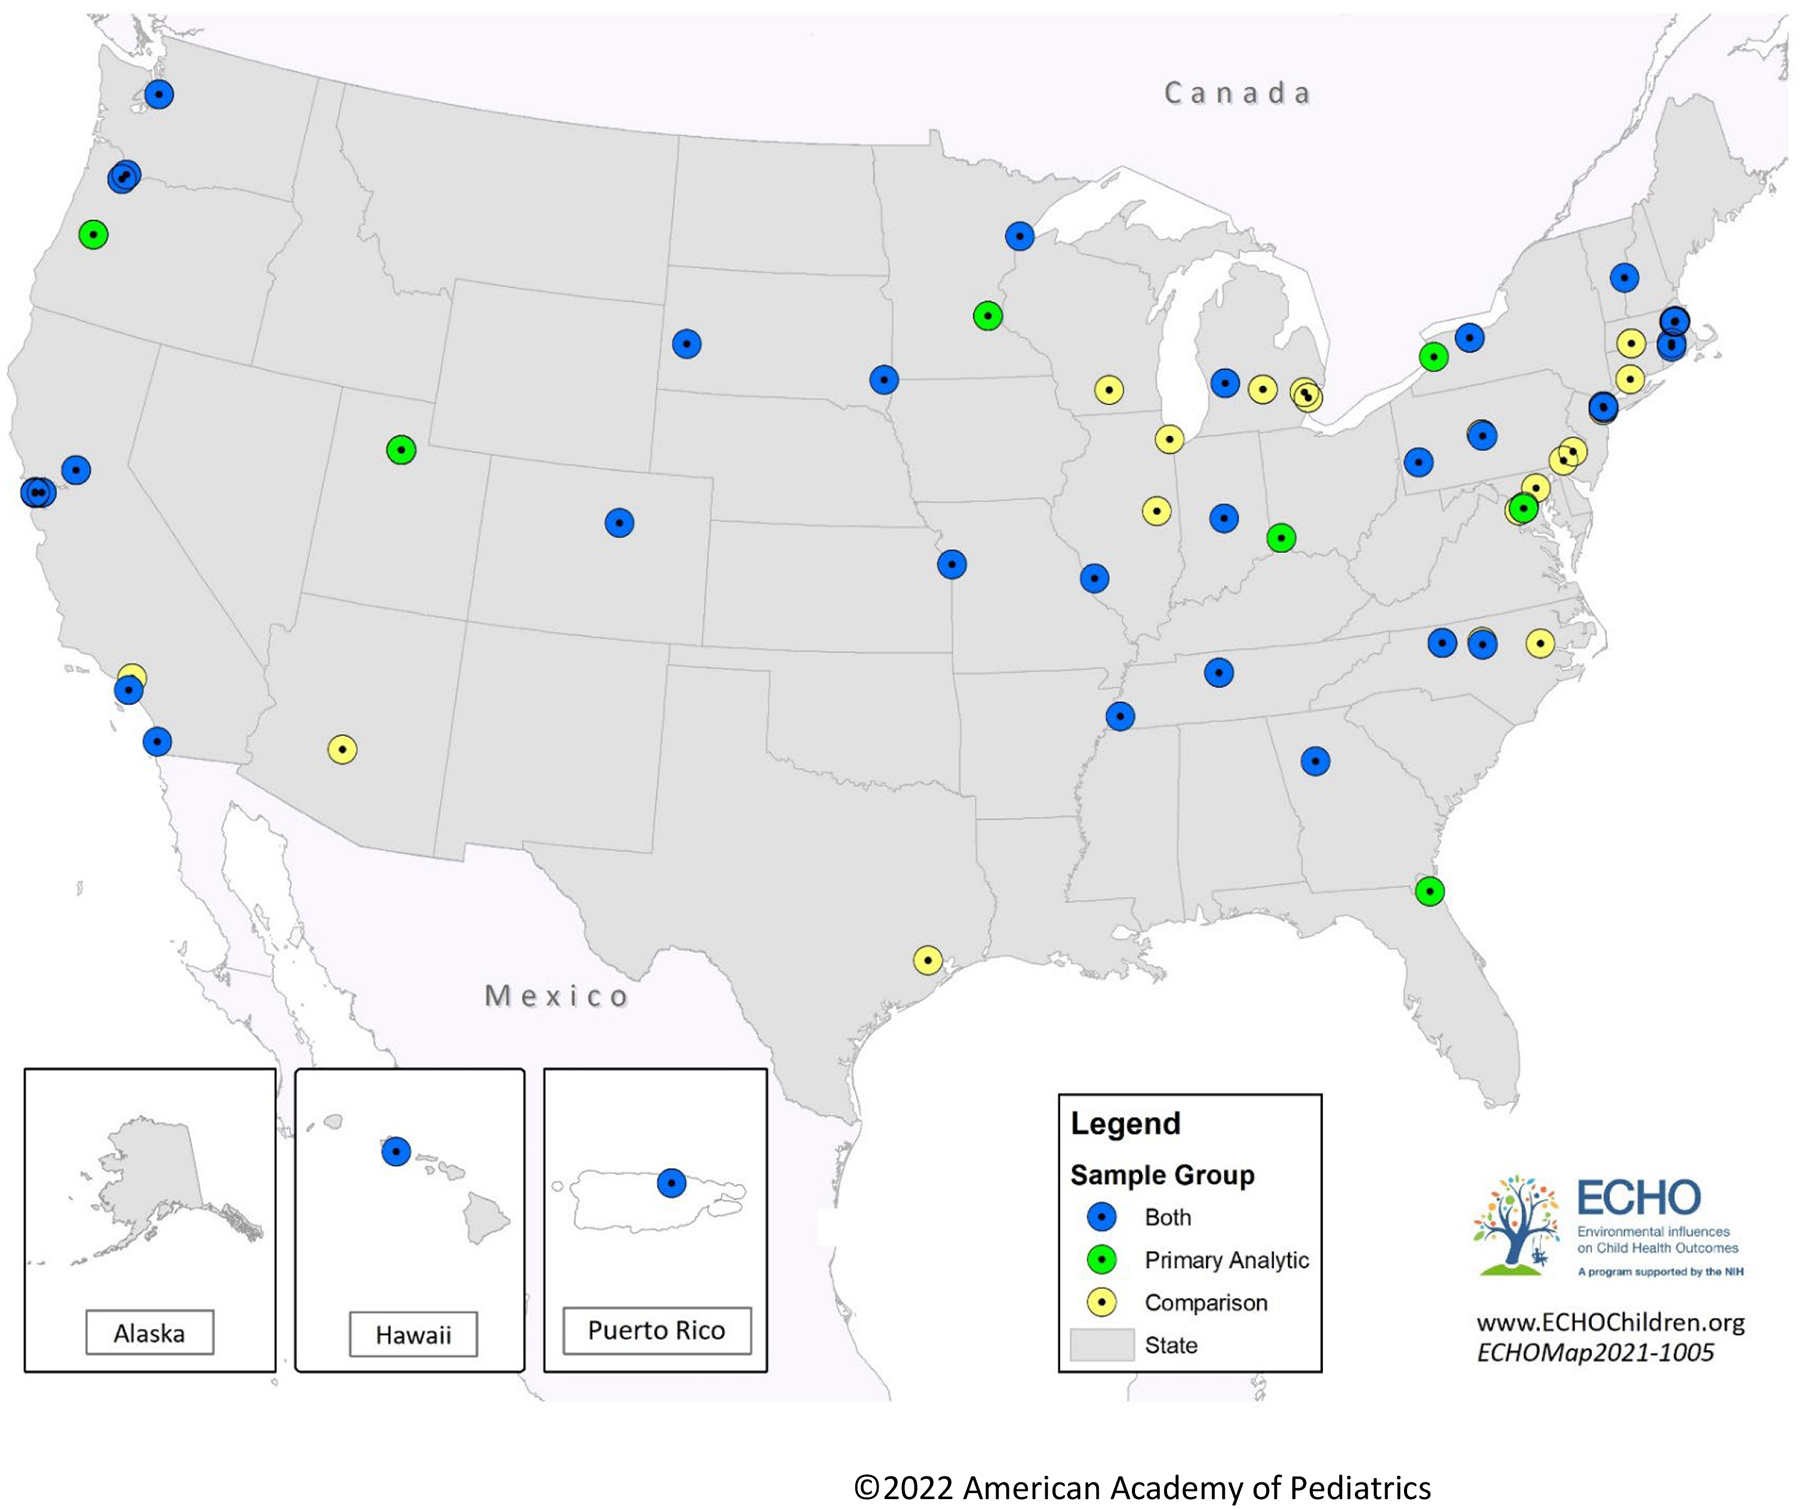
Figure 1. Map of Participating Enrollment Sites.

Figure 1 shows the data collection and enrollment sites from which the study population is drawn. Sites that only contributed participants to the primary study sample are in green, sites that only contributed to the comparison sample are shown in yellow, and sites that contributed participants to both samples are shown in blue.
