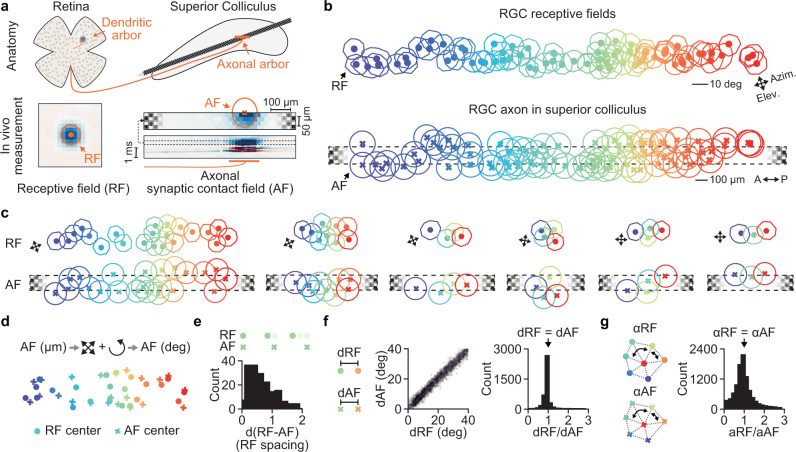
Fig. 2. Single cell precise spatial mapping between RGC receptive fields and RGC axons.
a Characterization of RGC dendritic and axonal arbors using in vivo measurements. The spatial location of the RGC dendrites can be estimated in vivo by mapping the visual receptive field (RF) (left). The spatial location of the RGC axonal arbors in SC can be measured in vivo by the axonal synaptic contact field (AF) (right). The AF is the area on the high-density electrode with evoked postsynaptic responses in SC. b RFs and AFs of simultaneously recorded RGCs. The color code identifies individual RGCs. Note the similarity between the spatial organization at the level of the receptive fields and axonal fields within SC. c Examples of simultaneously recorded RGCs with similar visually evoked activity. The single cell precise spatial mapping between RFs and AFs is evident. Note that the example on the left is a subset of RGCs shown in b. d Overlay of the RF/AF centers. For the overlay the AF centers was transformed from SC space (µm) into visual space (deg) by scaling and rotating the AF centers. This transformation preserves the geometrical properties of the AF centers. e Histogram of the distances between RF and AF centers in the unit of RF spacing. The RF spacing is the median RF distance between neighboring RGCs. The RF/AF above the histogram illustrate the distance at 0, 1 and 2 RF spacing. f Distances between RFs and AFs are similar. dRF plotted against dAF and the histogram of the ratio between dRF and dAF (n = 4028 RGC pairs). g Angles between RFs (αRF) and AFs (αAF) match shown in the histogram of the ratio αRF/αAF. Angles were measured between triples of RGCs (n = 10337 RGC triples). e–g from n = 5 mice. Source data are provided as a Source Data file.

