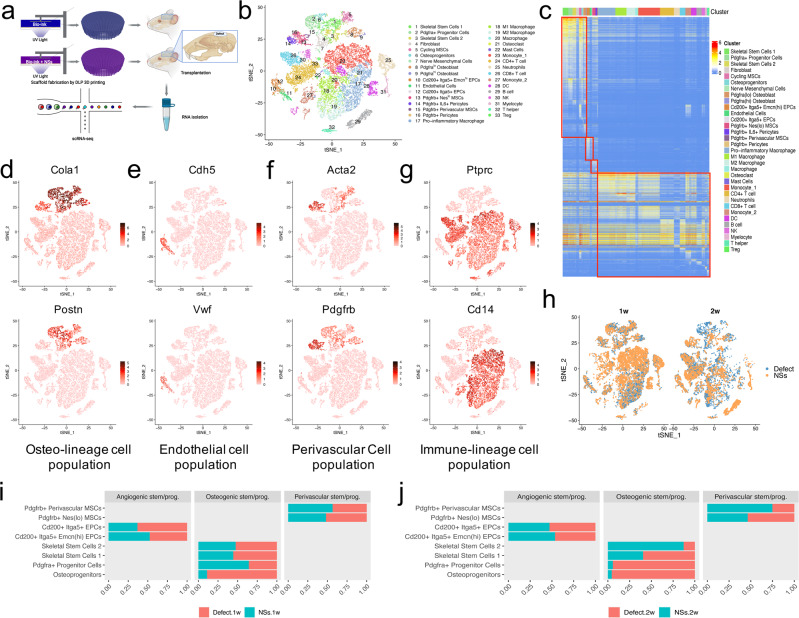
Fig. 3. Four cell clusters were differentially regulated by in situ culture system with NSs during bone regeneration.
a Workflow of sample isolation, mRNA libraries preparation, and single-cell RNA sequencing of regenerated tissue from critical-sized calvarial defects with or without the implantation of in situ culture system of NSs-loaded 3D printed hydrogel scaffold, at both 1 week and 2 weeks after defect surgery. n = 6 rats per group and per time point (Created with BioRender.com). b tSNE plot shows the distribution of 26016 cells that divided into 33 sub-clusters. c Heatmap shows expression of marker genes of the 33 sub-clusters. Marker genes were selected according to p value (Wilcoxon Rank Sum test, top 10). d–g tSNE plots of the expression of specific genes, which mark four different cell populations (osteo-lineage cell population: Col1a1 and Postn; endothelial cell population: Cdh5 and Vwf; perivascular cell population: Acta2 and Pdgfrb; immune-lineage cell population: CD45 and CD14). h Distribution of cells from different time and treatments that visualized by tSNE plots. 1w represents 1 week after defect surgery; 2w represents 2 weeks after defect surgery. i, j Barplots of the relative proportion of different sub-clusters in three main cell populations between two groups at 1 week and 2 weeks after surgery, respectively.

