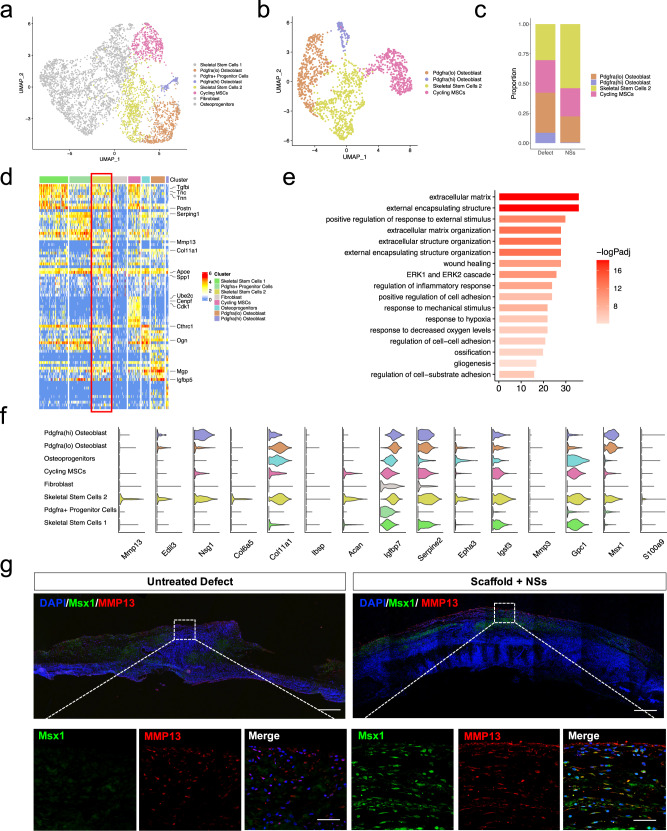
Fig. 5. Msx1+ SSCs subset was locally expanded by the in situ culture system with NSs.
a Visualization of SSC2 differentiation lineage cells in osteo-lineage cells with UMAP plot, highlighting four specific subsets. b UMAP plot of the four specific subsets. c Relative proportion of cell subsets between Defect and NSs group. d Heatmap and the expression of marker genes of 8 osteo-lineage sub-clusters. Marker genes are provided in source data. e Barplot showing the GO enrichment in SSC2 subset. Markers used for enrichment analysis were selected according to p value (*p < 0.05, Wilcoxon Rank Sum test) and fold change (>1). Color bar represented the adjusted p values performed by R package clusterProfiler (Benjamini–Hochberg). f Violin plot showing the SSC2 top marker gene expression levels across the whole 8 different subsets. g Co-immunostaining of Msx1 and Mmp13 expression of paraffin sections in Untreated Defect group and Scaffold + NSs group at 2 weeks after defect surgery (bar = 200 μm at low magnification and bar = 30 μm at high magnification), at least three times of experiments were repeated independently.

