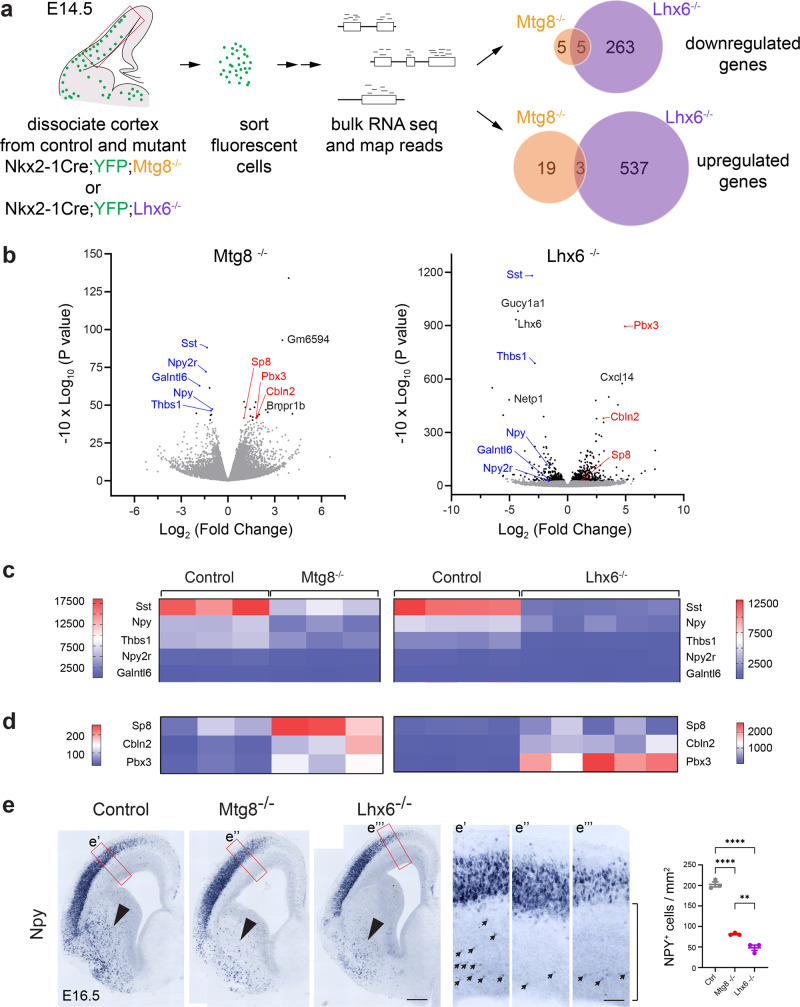
Fig. 4. Sst and Npy are common target genes downstream of MTG8 and LHX6.
a Experimental design for identification of downstream genes requiring MTG8 and/or LHX6 function within the MGE-derived cortical interneuron lineage using transcriptomic profiling of purified cells from E14.5 neocortex. b Volcano plots showing statistical significance (−10x log10 P values) against fold change (log2 fold change) between control and mutant MGE-derived cells for Mtg8 and Lhx6. Negative Log2 fold change values indicate decreased expression in mutants compared to controls. Positive Log2 fold change values indicate increased expression in mutants compared to controls. DEGs with a padj <0.05 are shown in black/blue/red. Common DEGs in both Mtg8 and Lhx6 mutants are indicated in blue (downregulated) and red (upregulated). c, d Heatmaps showing common downregulated (c) and common upregulated (d) genes in Mtg8 and Lhx6 mutant animals. Sst and Npy are among the top downregulated genes in both mutants. e Representative coronal sections through the embryonic telencephalon at the level of the developing septum at E16.5 showing expression of Npy in control, Mtg8−/− and Lhx6−/− mutant animals. An area of the developing neocortex is shown at higher magnification in e’–e”’. Arrows indicate migrating Npy-expressing cortical interneurons in the SVZ/IZ. Quantification represents Npy+ve cells in the developing neocortex in the SVZ/IZ areas underneath the CP (area indicated in e”). Reduced expression of Npy can be seen in the developing basal ganglia (arrowheads) and neocortex (arrows) of both mutants. n = 3 embryonic brains for each genotype. One-way ANOVA followed by Uncorrected Fisher’s LSD tests. ****P < 0.0001, **P = 0.0042. Graph shows mean ± SEM. Source data are provided as a Source Data file. Scale bars: 250 μm and higher magnification 60 μm.

