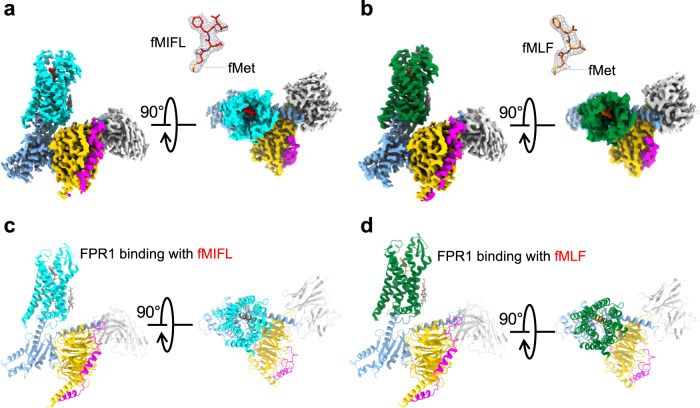
Fig. 1. EM density map and overall structure of FPR1-Gi-scFv16 bound to N-formyl peptides.
a, b Side view and extracellular view of the 3D cryo-EM density map of FPR1-Gi-scFv16 bound to fMIFL (a) and fMLF (b). The position of the N-terminal fMet is marked (insets). c, d Side view and extracellular view of the overall structure in cartoon representations. FPR1 bound to formyl peptide is colored in cyan (c, fMIFL) or green (d, fMLF), respectively. Gαi, Gβ1, Gγ2, scFv16 are colored in marine blue, yellow, magenta, and gray, respectively.

