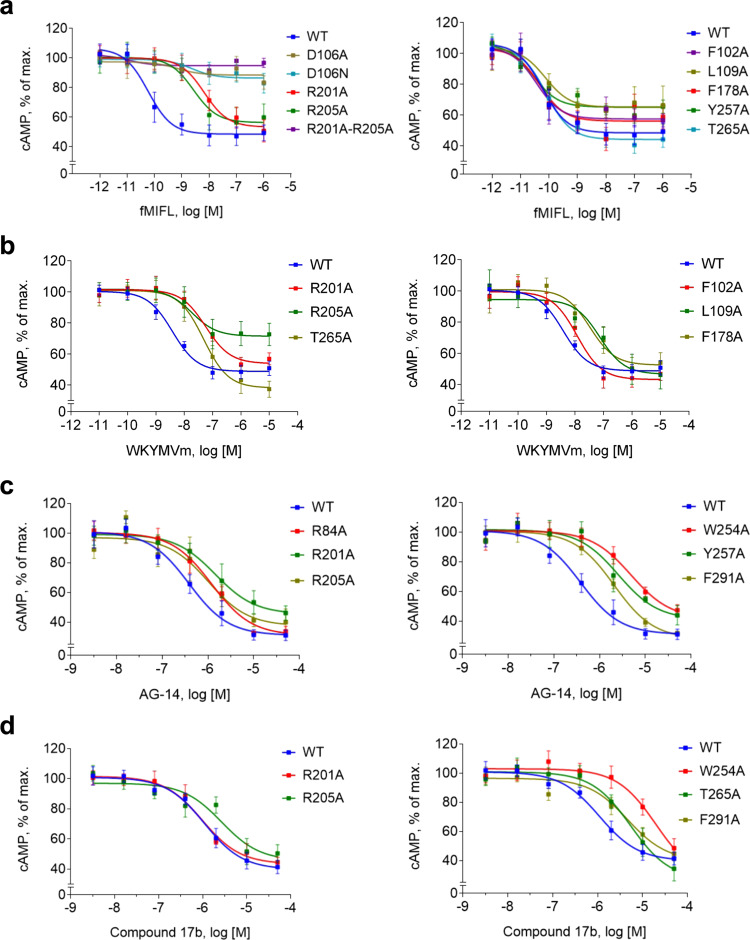
Fig. 5. Dose-response curves of FPR1 and its mutants in cAMP inhibition assays.
FPR1 and selected mutants were expressed in transiently transfected cells. The receptors were stimulated with different concentrations of the indicated agonists, fMIFL (a), WKYMVm (b), AG-14 (c) or Compound 17b (d) plus forskolin for 30 min. Changes in cytoplasmic cAMP concentrations were measured and data were plotted with the maximal cAMP concentrations set as 100%. Data are shown as mean ± SEM of three independent experiments, each in duplicates. Source data are provided as a Source Data file.

