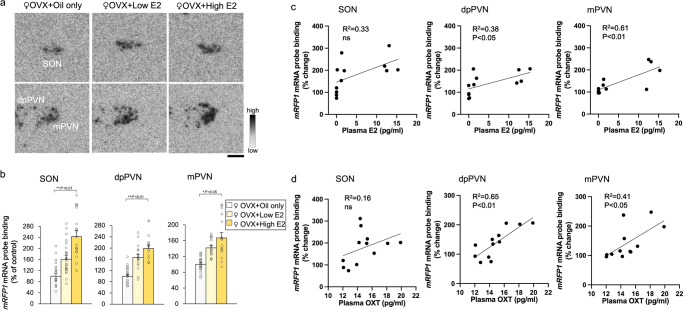
Fig. 6. Effects of oestrogen replacement on mRFP1gene expression.
a Representative images hybridised with a 35S-labelled oligodeoxynucleotide probe complementary to mRFP1 in the SON, dpPVN, and mPVN of female OXT-mRFP1 transgenic rats in the OVX + oil-only (n = 6), OVX + low E2 (n = 6), and OVX + high E2 (n = 6) groups, respectively. The scale bar indicates 100 μm. b mRFP1 mRNA in the SON, dpPVN, and mPVN of the rats (OVX + oil-only, OVX + low E2, and OVX + high E2 groups). The data are presented as the mean ± SEM (one-way ANOVA) (**P < 0.01, *P < 0.05, compared with OVX + oil only group). c Regression analysis for plasma E2 and changes in mRFP1 mRNA levels in the SON, dpPVN, and mPVN. The regression line and probability value for the slope are shown. The statistical significance of the slope was set at P < 0.05. d Regression analysis for plasma OXT and changes in mRFP1 mRNA levels in the SON, dpPVN, and mPVN. The regression line and probability value for the slope are shown. The statistical significance of the slope was set at P < 0.05.

