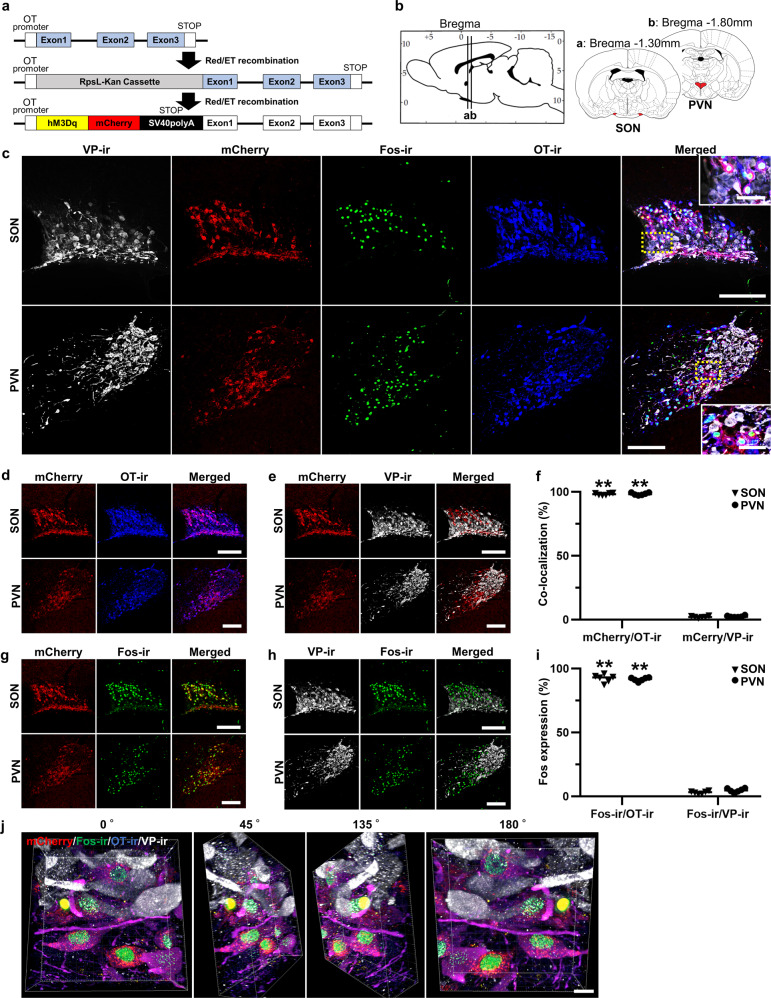
Fig. 1. Generation of the OT-hM3Dq-mCherry transgenic rat line.
a A concept of generating oxytocin (OT)-hM3Dq-mCherry transgenic rat. b Schematic illustration of the supraoptic (SON) and paraventricular nuclei (PVN). c Confocal images of vasopressin (VP)-immunoreactivity (ir), endogenous mCherry, Fos-ir, OT-ir, and merged images of the SON and PVN at 120 min after the subcutaneous (s.c.) injection of clozapine-N-oxide (CNO, 1 mg kg−1). Rectangles framed by yellow dotted lines are enlarged in magnified images. d Confocal images of endogenous mCherry, OT-ir, and merged images of the SON and PVN. e Percentage of co-localization of endogenous mCherry, VP-ir, and merged images of the SON and PVN. f Co-localization of mCherry with OT-ir or VP-ir neurons in the SON and PVN (n = 12 slices from 6 rats, each). g Co-localization of endogenous mCherry, Fos-ir, and merged images of the SON and PVN at 120 min after the s.c. injection of CNO. h Co-localization of VP-ir, Fos-ir, and merged images of the SON and PVN at 120 min after the s.c. injection of CNO. i Percentage of Fos-ir positive neurons in mCherry positive neurons or VP-ir positive neurons at 120 min after the s.c. injection of CNO in the SON and PVN (n = 12 slices from 6 rats, each). j Three-Dimensional reconstructed image (endogenous mCherry (red), FIHC for Fos (green), OT (blue) and VP (white)) of the SON at 120 min after s.c. injection of CNO. Scale bars in (a–h), 200 μm and 50 μm (in magnified images). Scale bar in (j), 10 μm.

