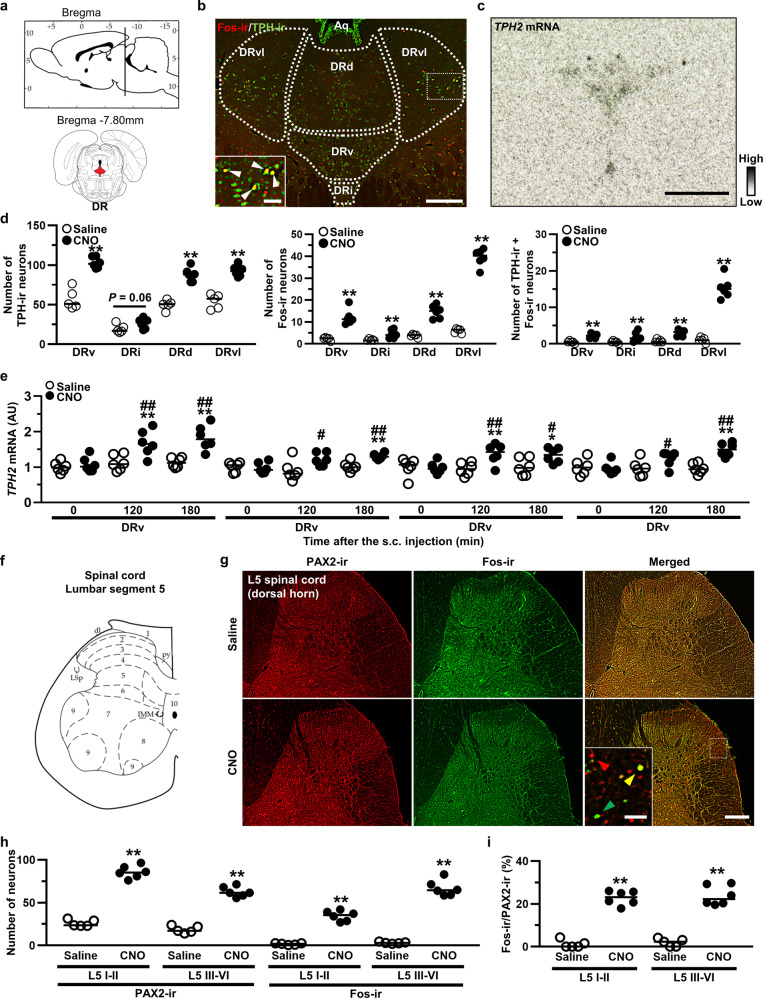
Fig. 4. OT-activated serotonergic neurons in the DR and inhibitory interneurons in the spinal dorsal horn.
a Schematic illustration of the dorsal raphe nucleus (DR). b Tryptophan hydroxylase (TPH)-ir and Fos-ir in the DR at 120 min after the s.c. injection of CNO (1 mg kg−1). DR were divided into ventral (DRv), inter-fascicular (DRi), dorsal (DRd) and ventrolateral “wings” (DRvl). c ISH image of TPH2 in the DR. d TH-ir neurons, Fos-ir neurons and percentage of their co-expression in the DR (n = 10–12 slices from 5 to 6 rats, each). e Gene expression of TPH2 in the DR after the s.c. injection of Saline or CNO (n = 12 slices from 6 rats, each). f Schematic illustration of the lumbar segment 5 (L5) in the spinal cord. g PAX2-ir, Fos-ir and merged images in the L5 spinal cord at 120 min after the s.c. injection of CNO. h PAX2-ir neurons in the superficial layer (laminae I–II) and deeper layer (laminae III–VI) of the L5 (n = 10–12 slices from 5 to 6 rats, each). i Percentage of co-localization of Fos-ir and PAX2-ir neurons in the L5 (n = 10–12 slices from 5 to 6 rats, each). Scale bars, 200 μm and 50 μm (in magnified images). *P < 0.05; **P < 0.01 vs. Saline. #P < 0.01; ##P < 0.01 vs. CNO at 0 min. See also Supplementary Figs. 3, 4.

