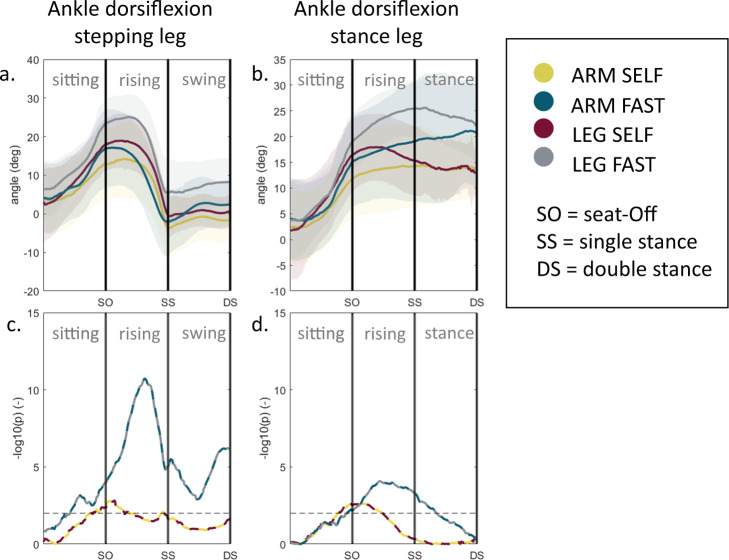
Fig. 4. Joint angle trajectories during sit-to-walk for distinct arm strategies.
a, b Trajectory comparison between ARM and LEG of the ankle joint angles. The stepping leg is the leg that steps out first. c, d Trajectory analysis: t tests were performed for every time sample. The level of significance is visualized as the negative base-10 logarithm of the p value so that large values represent small p values; black dashed horizontal line indicates a significant difference (p < 0.01).

