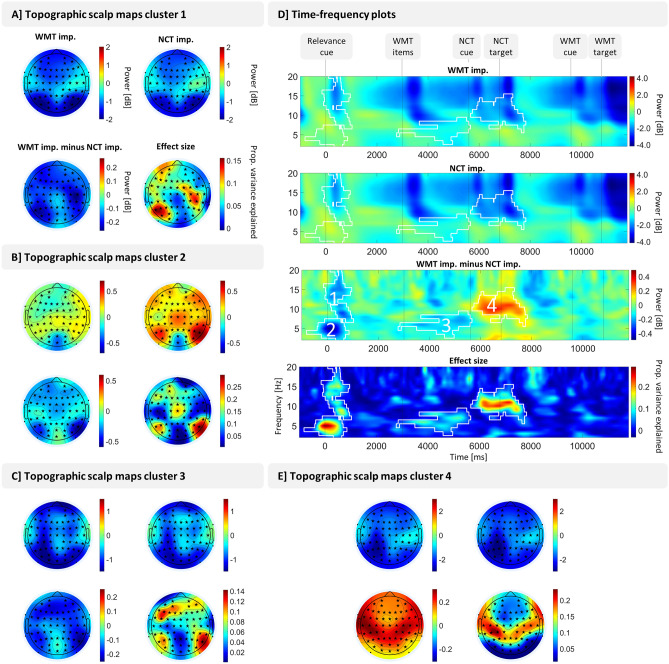
Figure 2.
Result of univariate power analysis. A cluster-based permutation test in the electrode × time × frequency space comparing power in number classification task important (NCT imp.) trials and working memory task important (WMT imp.) trials revealed four significant clusters. Panel (A), (B), (C) and (E) show topographic scalp maps averaged over significant time–frequency points of the respective cluster. Significant channels are marked with a black asterisk, not significant channels with a black dot. Panel (D) shows time-frequency plots with power values averaged over all channels (as the four clusters were all significant at nearly all channels). Contour lines frame significant time–frequency points and the numbers label the clusters from 1 to 4. Effect sizes are adjusted partial eta squared. Power values are decibel-normalized with a condition-unspecific baseline ranging from 700 to 200 ms prior to the onset of the relevance cue.

