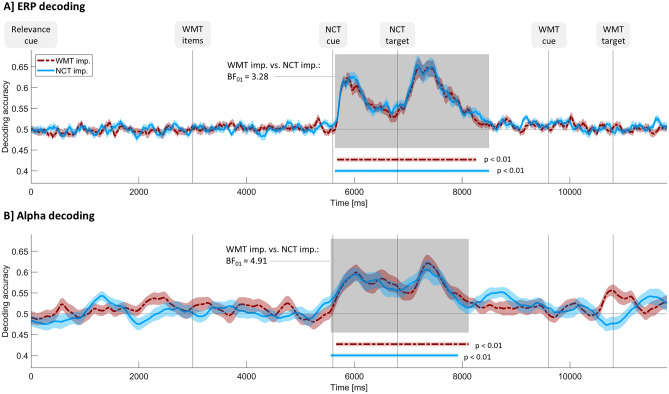
Figure 3.
Decoding accuracies over time for ERP (panel A) and alpha power (panel B) for both experimental conditions separately. The horizontal line at 0.5 indicates chance level. Vertical lines indicate stimuli onset times. Shaded curve surroundings indicate between-subject standard error of the mean. Horizontal colored lines mark significant time points according to cluster-based permutation tests over time. The grey shading indicates time points where at least one experimental condition differs significantly from zero according to those tests. BF01 reverse Bayes factor calculated for decoding accuracies averaged over the time points marked by the grey shading comparing WMT imp. and NCT imp., WMT working memory task, NCT number classification task, imp. important.

