Figure 4.
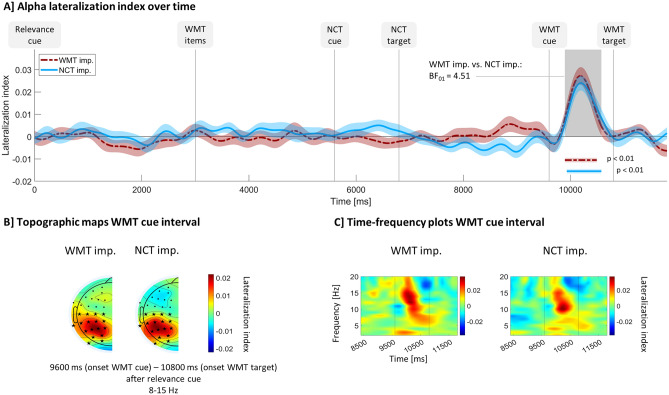
Alpha power asymmetry relative to WMT cue direction. All panels show lateralization index values, i.e., raw power at the hemisphere ipsilateral to the side the working memory task cue points to minus raw power contralateral to this side divided by raw power across both hemispheres. Index values above zero are thought to reflect greater attention toward the cued memory item relative to the un-cued item. (A) Time course of lateralization indices averaged over 8–15 Hz and occipito-parietal electrodes (see electrodes marked with an asterisk in panel (B). Shaded curve surroundings indicate between-subject standard error of the mean. Vertical lines mark stimuli onsets and horizontal, colored lines mark significant time points according to cluster-based permutation tests over time. The grey shading indicates time points where at least one experimental condition differs significantly from zero according to those tests. BF01 = reverse Bayes factor calculated for lateralization indices averaged over the time points marked by the grey shading comparing WMT imp. and NCT imp. (B) Topographic scalp maps of lateralization indices averaged over 8–15 Hz and a time interval starting with working memory task cue onset and ending with working memory task target onset. Electrodes that were used for statistical analysis are marked with a black asterisk; other electrodes are marked with a black dot. As lateralization indices measure the hemispheric difference, scalp maps are per definition symmetric and only one half is displayed here. (C) Frequency distribution of lateralization index around the working memory task cue onset. Vertical lines indicate working memory task cue and working memory task target onset. Times are relative to relevance cue onset. WMT working memory task, NCT number classification task, imp. important.

