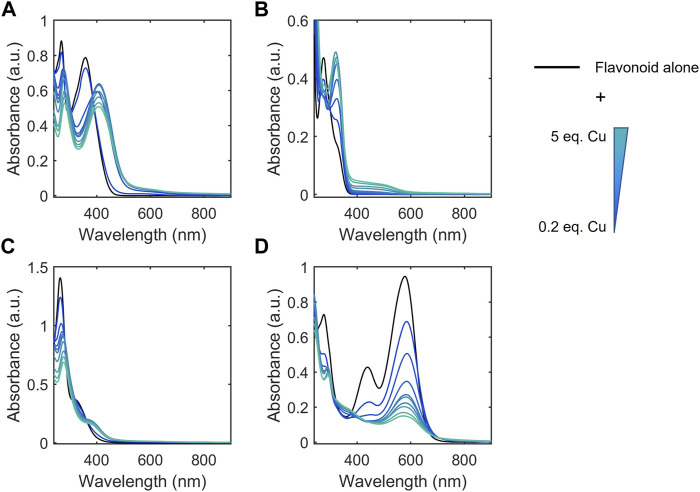
FIGURE 2.
Electronic absorption spectra of representative flavonoids (A) luteolin, (B) EGCG, (C) biochanin A, and (D) cyanidin (black) in 50 mM MOPS buffer (pH 7.4) titrated with CuSO4. Flavonoids were prepared at 50 µM and CuSO4 was titrated into the solution from 0.2 to 5 molar equivalences. Flavonoids typically have two distinct absorption bands: a strong absorbance between 270 and 295 nm (Band II) and a weak Band I absorbance that appears as a shoulder at slightly longer wavelengths. Changes in the intensities and shifts in the lambda max wavelengths of these bands, indicate interactions of Cu(II) with the flavonoids. Electronic absorption spectra of the remaining flavonoids tested are shown in Supplementary Figure S1.

