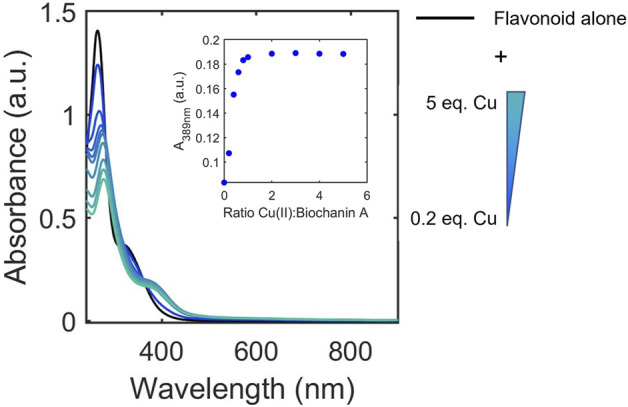
FIGURE 5.

Representative electronic absorbance spectra of biochanin A upon addition of 0.2–5 equivalences of copper in 50 mM MOPS buffer (pH 7.4) for the determination of binding ratios. The inset shows absorbance at 389 nm where spectral changes occur due to Cu(II) binding to biochanin A. The changes in absorbance at 389 nm plateau at 1 equivalence of Cu(II) which indicates a 1:1 binding ratio between biochanin A and Cu(II).
