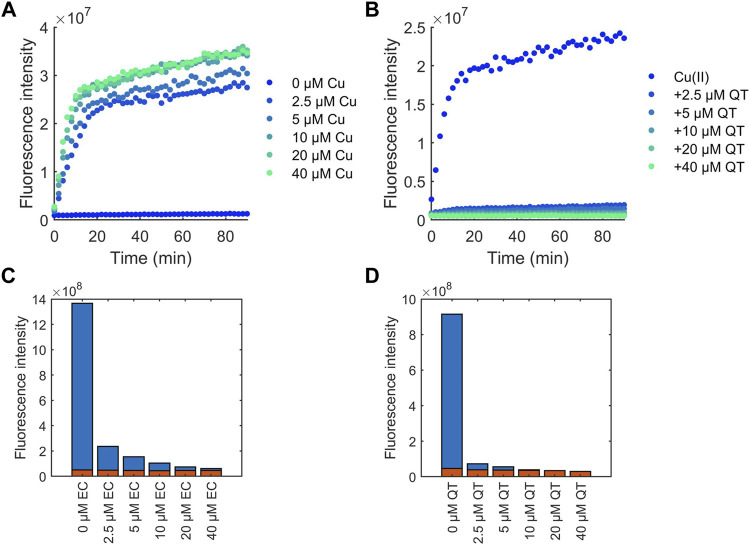
FIGURE 7.
CCA fluorescence intensity measurements for determining the effects of flavonoids on the time-dependent generation of •OH. Flavonoid effects were compared to (A) Cu(II) addition alone, with (B) QT shown as an example. 2.5 mM CCA and 50 μM ascorbic acid were used for all experiments. The calculated area under the curve over the course of 90 min was measured for flavonoid solutions. (C) EC and (D) QT effects are shown as representative plots in the presence (blue) and absence (red) of Cu(II).

