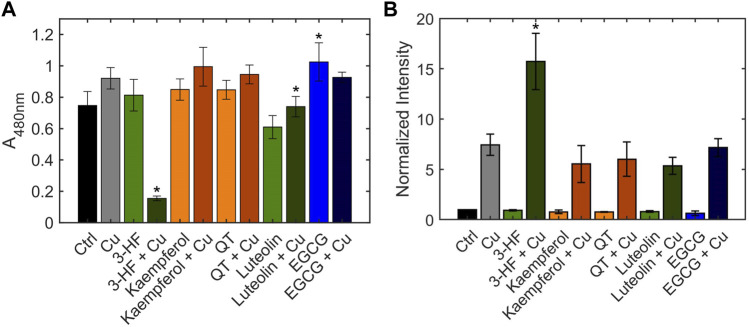
FIGURE 9.
(A) Cell viability of HepG2 cells in the presence and absence of flavonoids and Cu(II), measured using the MTS assay. HepG2 cells were stimulated with 20 μM flavonoid with or without 50 μM CuSO4. The MTS reagent was added after 24 h. After 1 h incubation with the reagent, absorbance was measured at 490 nm. (B) Quantification of total cellular copper of HepG2 cells in the presence and absence of flavonoids and Cu(II), measured by ICP-OES. HepG2 cells were stimulated with 20 μM flavonoid with or without 50 μM CuSO4 for 24 h. Error bars represent SD, n = 3. *p < 0.05 versus the vehicle control.

