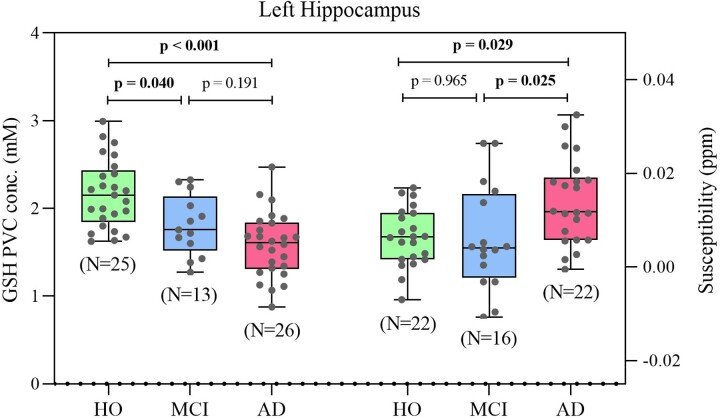
Figure 2.
GSH and iron level in HO, MCI and Alzheimer’s disease. Box plot of LH GSH concentration measured using MRS (left Y axis) and associated susceptibility with iron as dominant source measured using QSM (right Y axis) from each clinical cohort. Statistical analysis was done using one-way ANOVA test followed by Tukey–Kramer for post hoc multiple comparison

