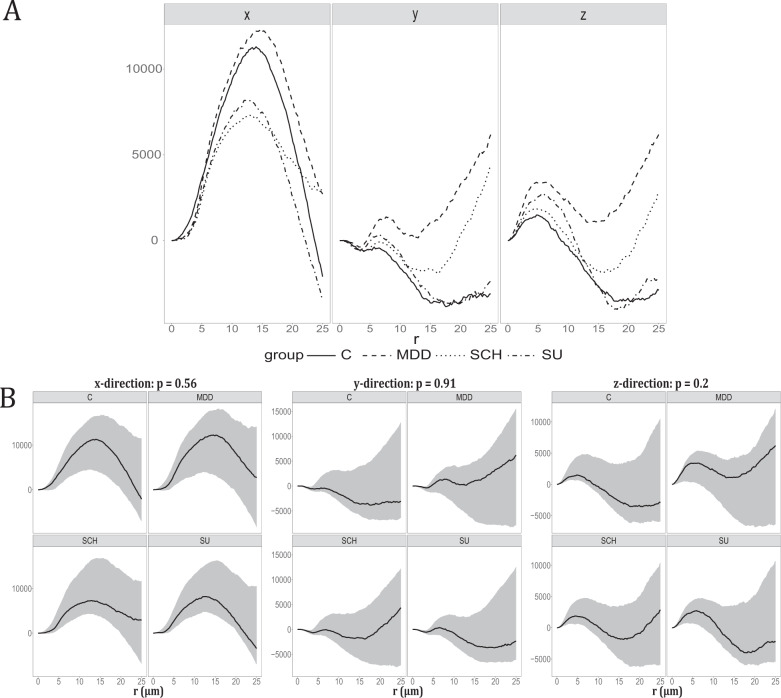
Fig. 4. Spatial point pattern analysis.
A Plot of the weighted mean of each group. The weighted mean of the empirical cylindrical K-functions minus the theoretical value under CSR in the direction shown at the top. The line type corresponds to the groups: Control (C), Major depressive disorder (MDD), Suicide (SU), and Schizophrenia (SCH) as stated in the legend. B Test the difference between groups in the x, y, and z-axes.95% Global envelope test for testing the hypothesis of no differences in the cylindrical K-functions of the four groups Control (C), Major depressive disorder (MDD), Suicide (SU), and Schizophrenia (SCH). There is a test for the cylindrical K-function in each of the directions of the x-, y-, and z-axes. The 95% global envelopes (gray area) were based on 8000 random permutations. The solid curves are the estimates obtained from data after the theoretical value under CSR was subtracted. The direction is stated at the top of each plot, as well as the p-value of the test.

