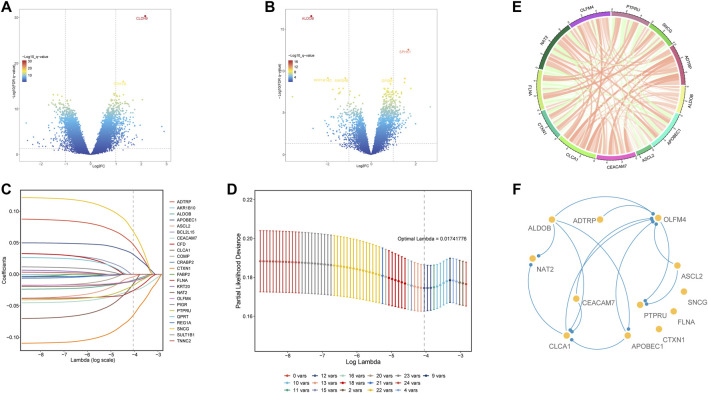
FIGURE 3.
Differential expression and analysis of glycolysis- and lactate-related genes among the four clusters. (A) DEGs between clusters 1 and 2. (B) DEGs between clusters 3 and 2. (C) LASSO coefficient profile of twelve OS-related glycolysis- and lactate-related genes. (D) Optimal tuning parameter of glycolysis- and lactate-related genes. (E) Gene expression correlations of twelve OS-related glycolysis- and lactate-related genes. (F) PPI network analysis of twelve OS-related glycolysis- and lactate-related genes.

