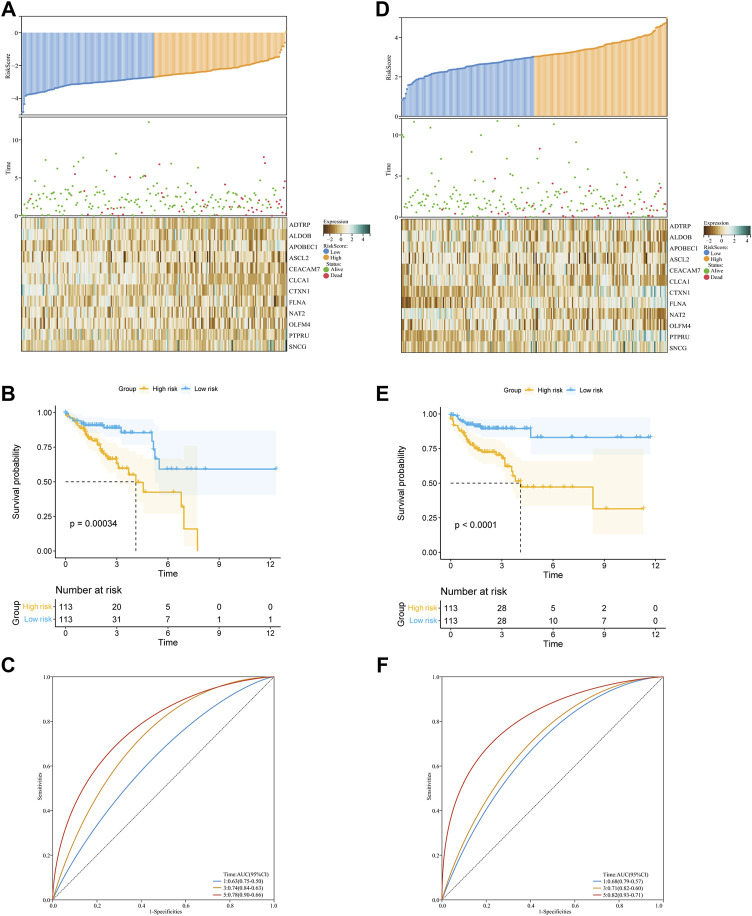
FIGURE 4.
Construction and validation of the glycolysis- and lactate-related gene prognostic signature. (A,D) Predictive ability of the prognostic signature in the training cohort (A) and validation cohort (D). Distribution of the risk score (upper), survival time (middle), and heatmap of selected glycolysis- and lactate-related genes (below). (B,E) KM survival curves of OS for COAD patients between the training cohort (B) and validation cohort (E). (C,F) ROC curves for the 1-, 3-, and 5-year survival in the training cohort (C) and validation cohort (F).

