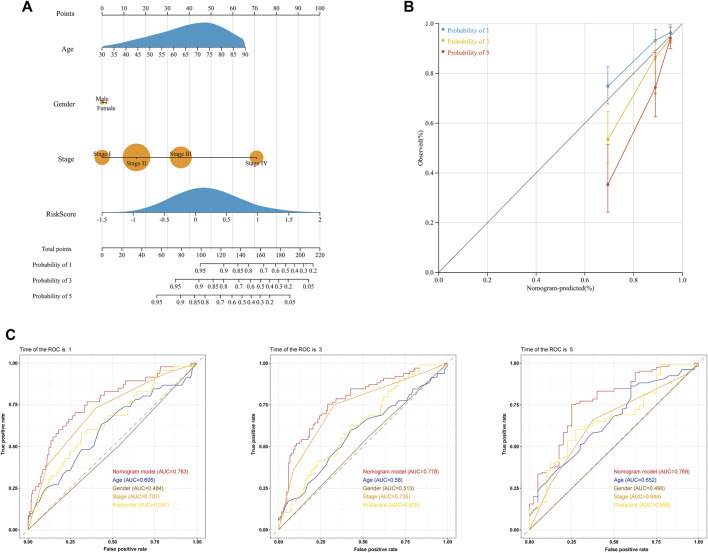
FIGURE 6.
Prediction of the OS of COAD patients using a clinical nomogram. (A) Nomogram for predicting the 1-, 3-, and 5-year OS of COAD patients. (B) Calibration curves of the nomogram for predicting OS at 1, 3, and 5 years. Nomogram-predicted survival is on the X-axis, and actual survival is on the Y-axis. (C) ROC curves of the nomogram for predicting the 1-, 3- and 5-year OS.

