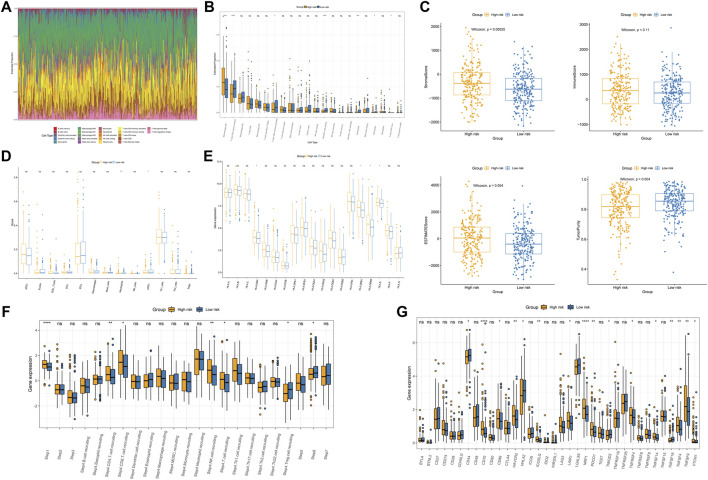
FIGURE 8.
Immune profiles between the two subgroups. (A) Immune cell proportions in COAD patients. (B) Analysis of twenty-two types of tumor-infiltrating immune cells. (C) Boxplot of the differences in the stromal score, immune score, ESTIMATE score, and tumor purity. (D) Comparison of the levels of infiltration of immune cells in the two groups. (E) Differences in MHC molecule expression. (F) Relative abundance of the antitumor immune response between the high- and low-risk groups. (G) Immune checkpoint expression in the high- and low-risk groups. *p < 0.05; **p < 0.01; ***p < 0.001; ****p < 0.0001; ns, not significant.

