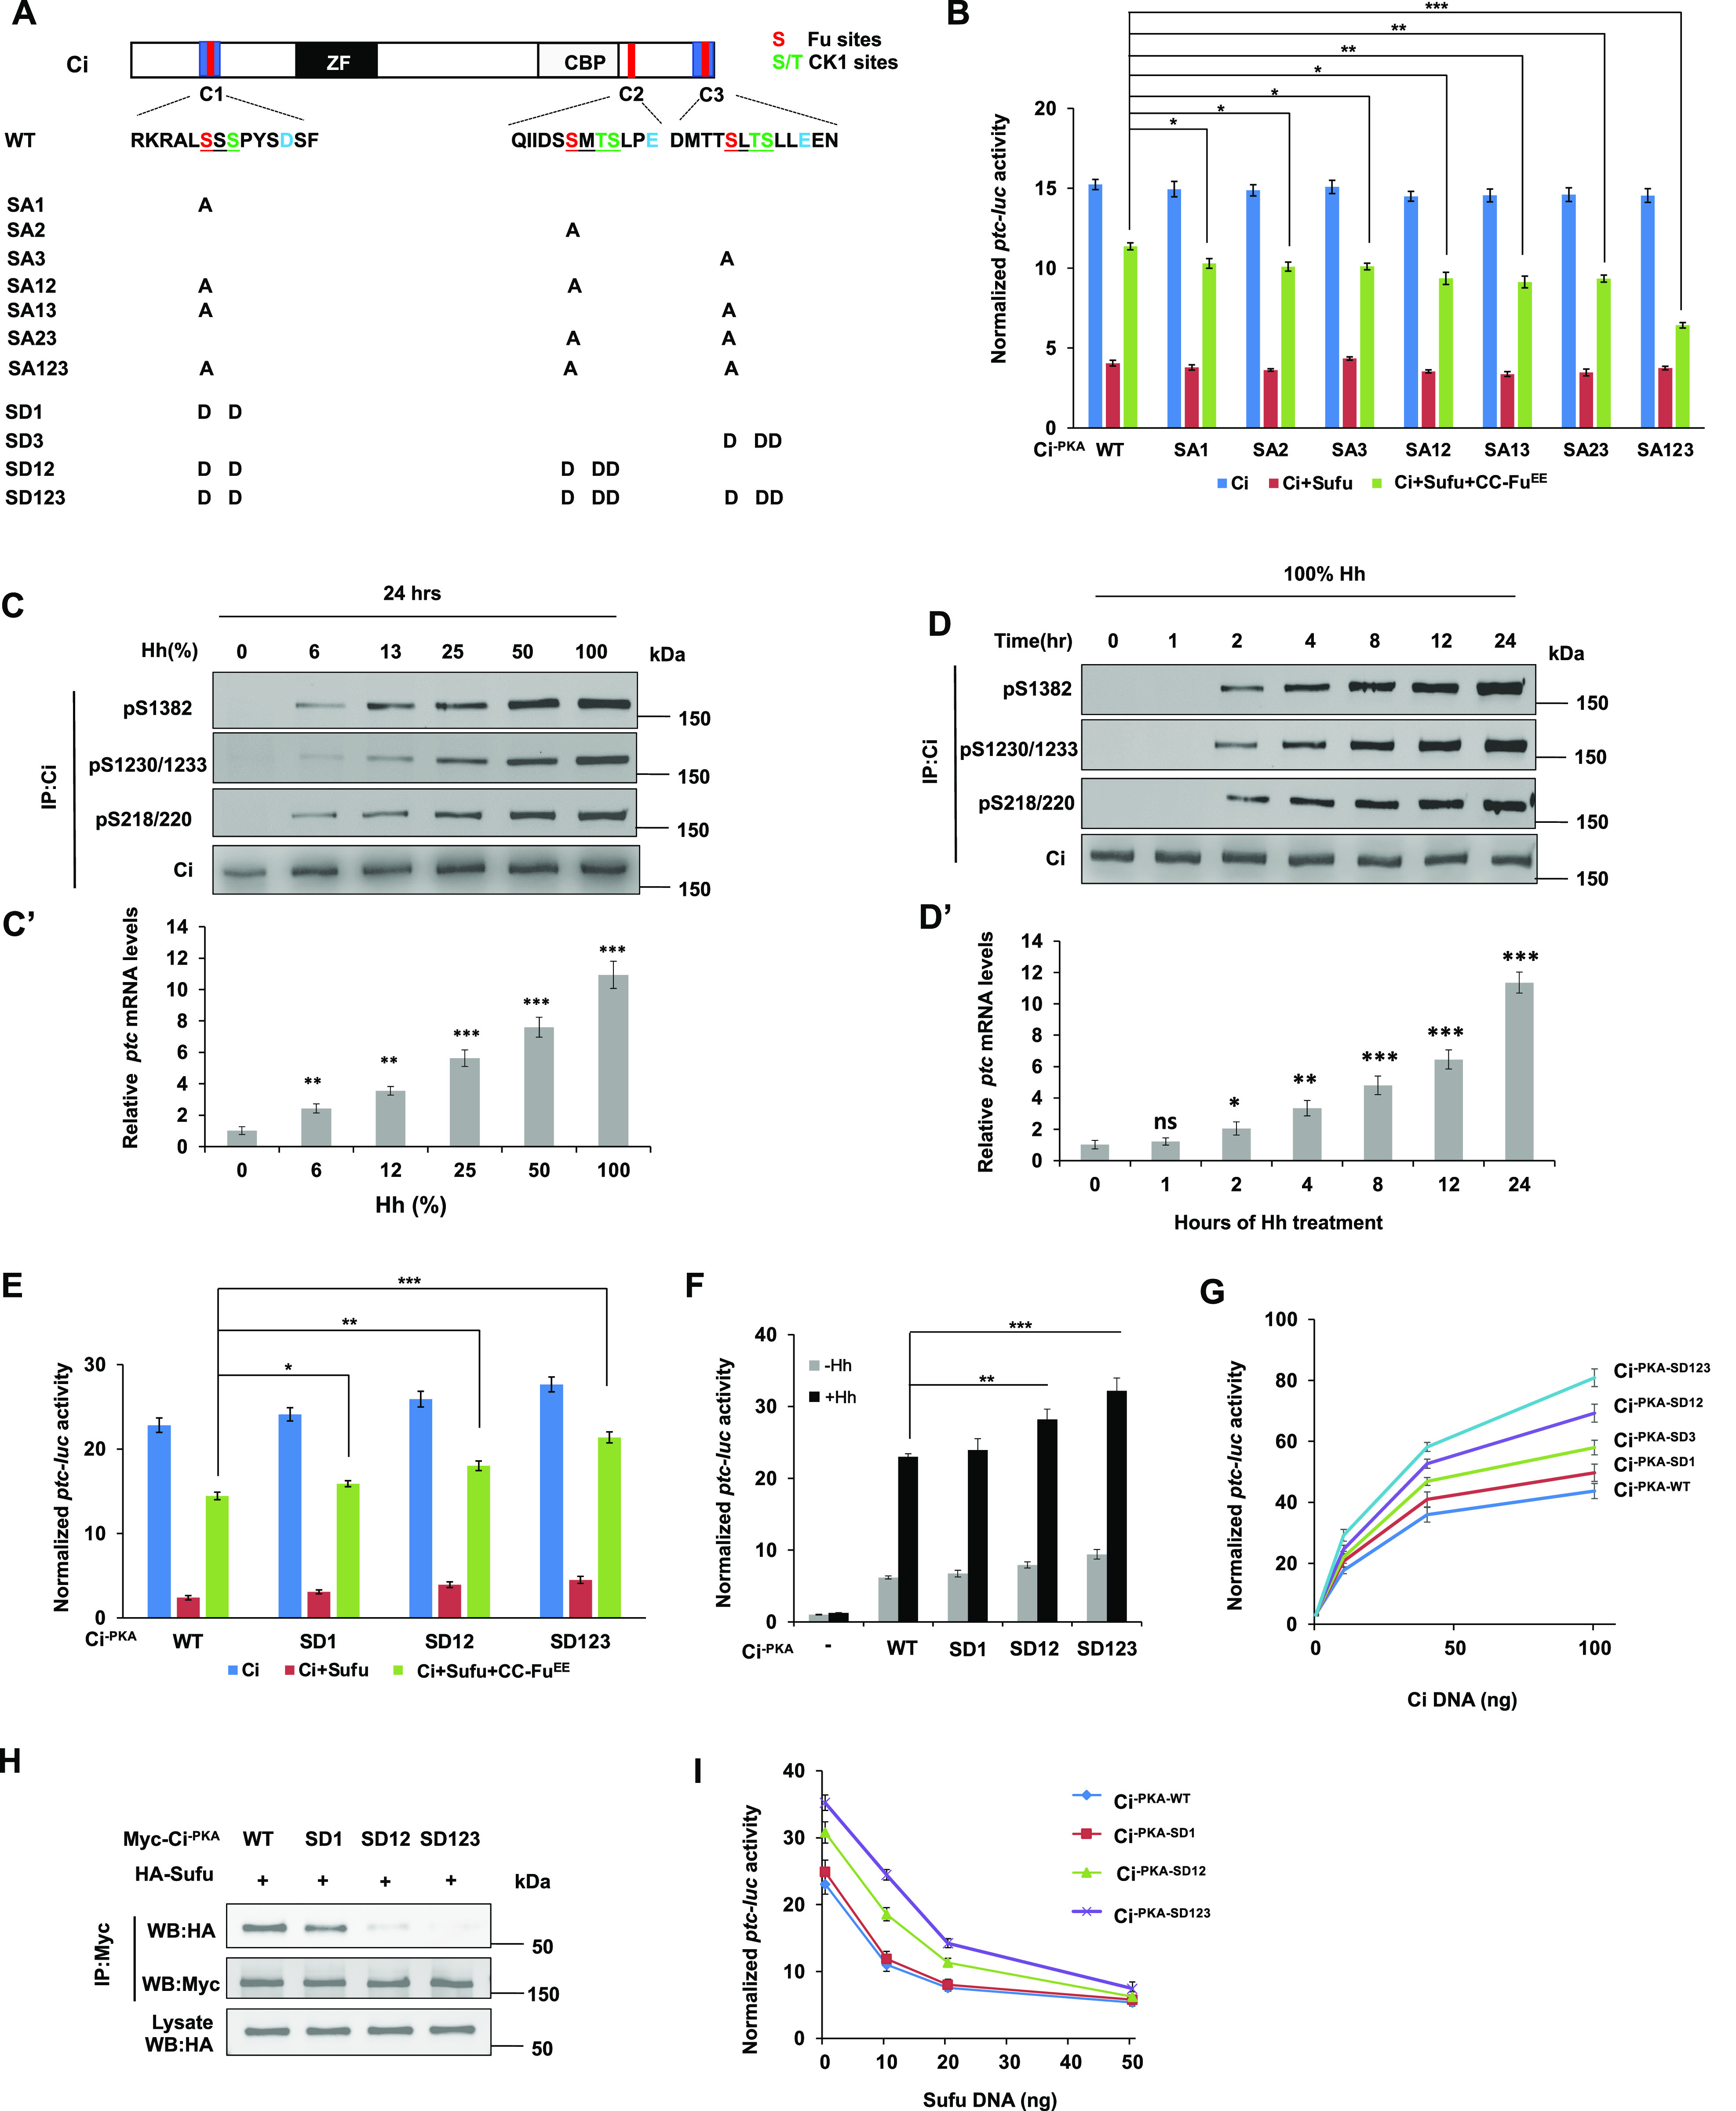
Figure 2. Dose-dependent phosphorylation and activation of Ci.

(A) Schematic diagram of Ci with primary sequences of the three phosphorylation clusters shown underneath. Fu and CK1 sites are color coded in “red” and “green,” respectively. Amino acid substitutions for individual Ci constructs are indicated. (B) ptc-luc reporter assay in S2R+ cells transfected with the indicated Myc-Ci-PKA constructs in the presence or absence of Sufu/CC-FuEE. (C, C’, D, D’) Western blot analyses of endogenous Ci phosphorylation on the indicated sites in Cl8 cells exposed to Hh at increasing concentrations for 24 h (C) or with 100% Hh for increasing amounts of time (D). Hh-conditioned medium was used at a 6:4 dilution ratio with fresh medium (defined as 100%). (C’, D’) Quantification of ptc mRNA expression by RT-qPCR in Cl8 cells exposed to Hh at increasing concentrations (C’) or duration (D’). (E) ptc-luc reporter assay in S2R+ cells transfected with the indicated Myc-Ci-PKA constructs in the presence or absence of Sufu/CC-FuEE. (F) ptc-luc reporter assay in S2R+ cells transfected with the indicated Ci constructs at low concentrations (5 ng/well) and treated with (+Hh) or without (−Hh) Hh-conditioned medium. (G) ptc-luc reporter assay in S2R+ cells transfected with increasing amounts of the indicated Ci constructs. (H) Co-immunoprecipitation assay in S2R+ cells transfected with the indicated Myc-Ci-PKA variants and HA-Sufu. (I) ptc-luc reporter assay in S2R+ cells transfected with a fixed amount of the indicated Ci constructs (50 ng/well) and increasing amounts of Sufu. Data are mean ± SD from three independent experiments. *P < 0.05, **P < 0.01, and ***P < 0.001 (t test).
