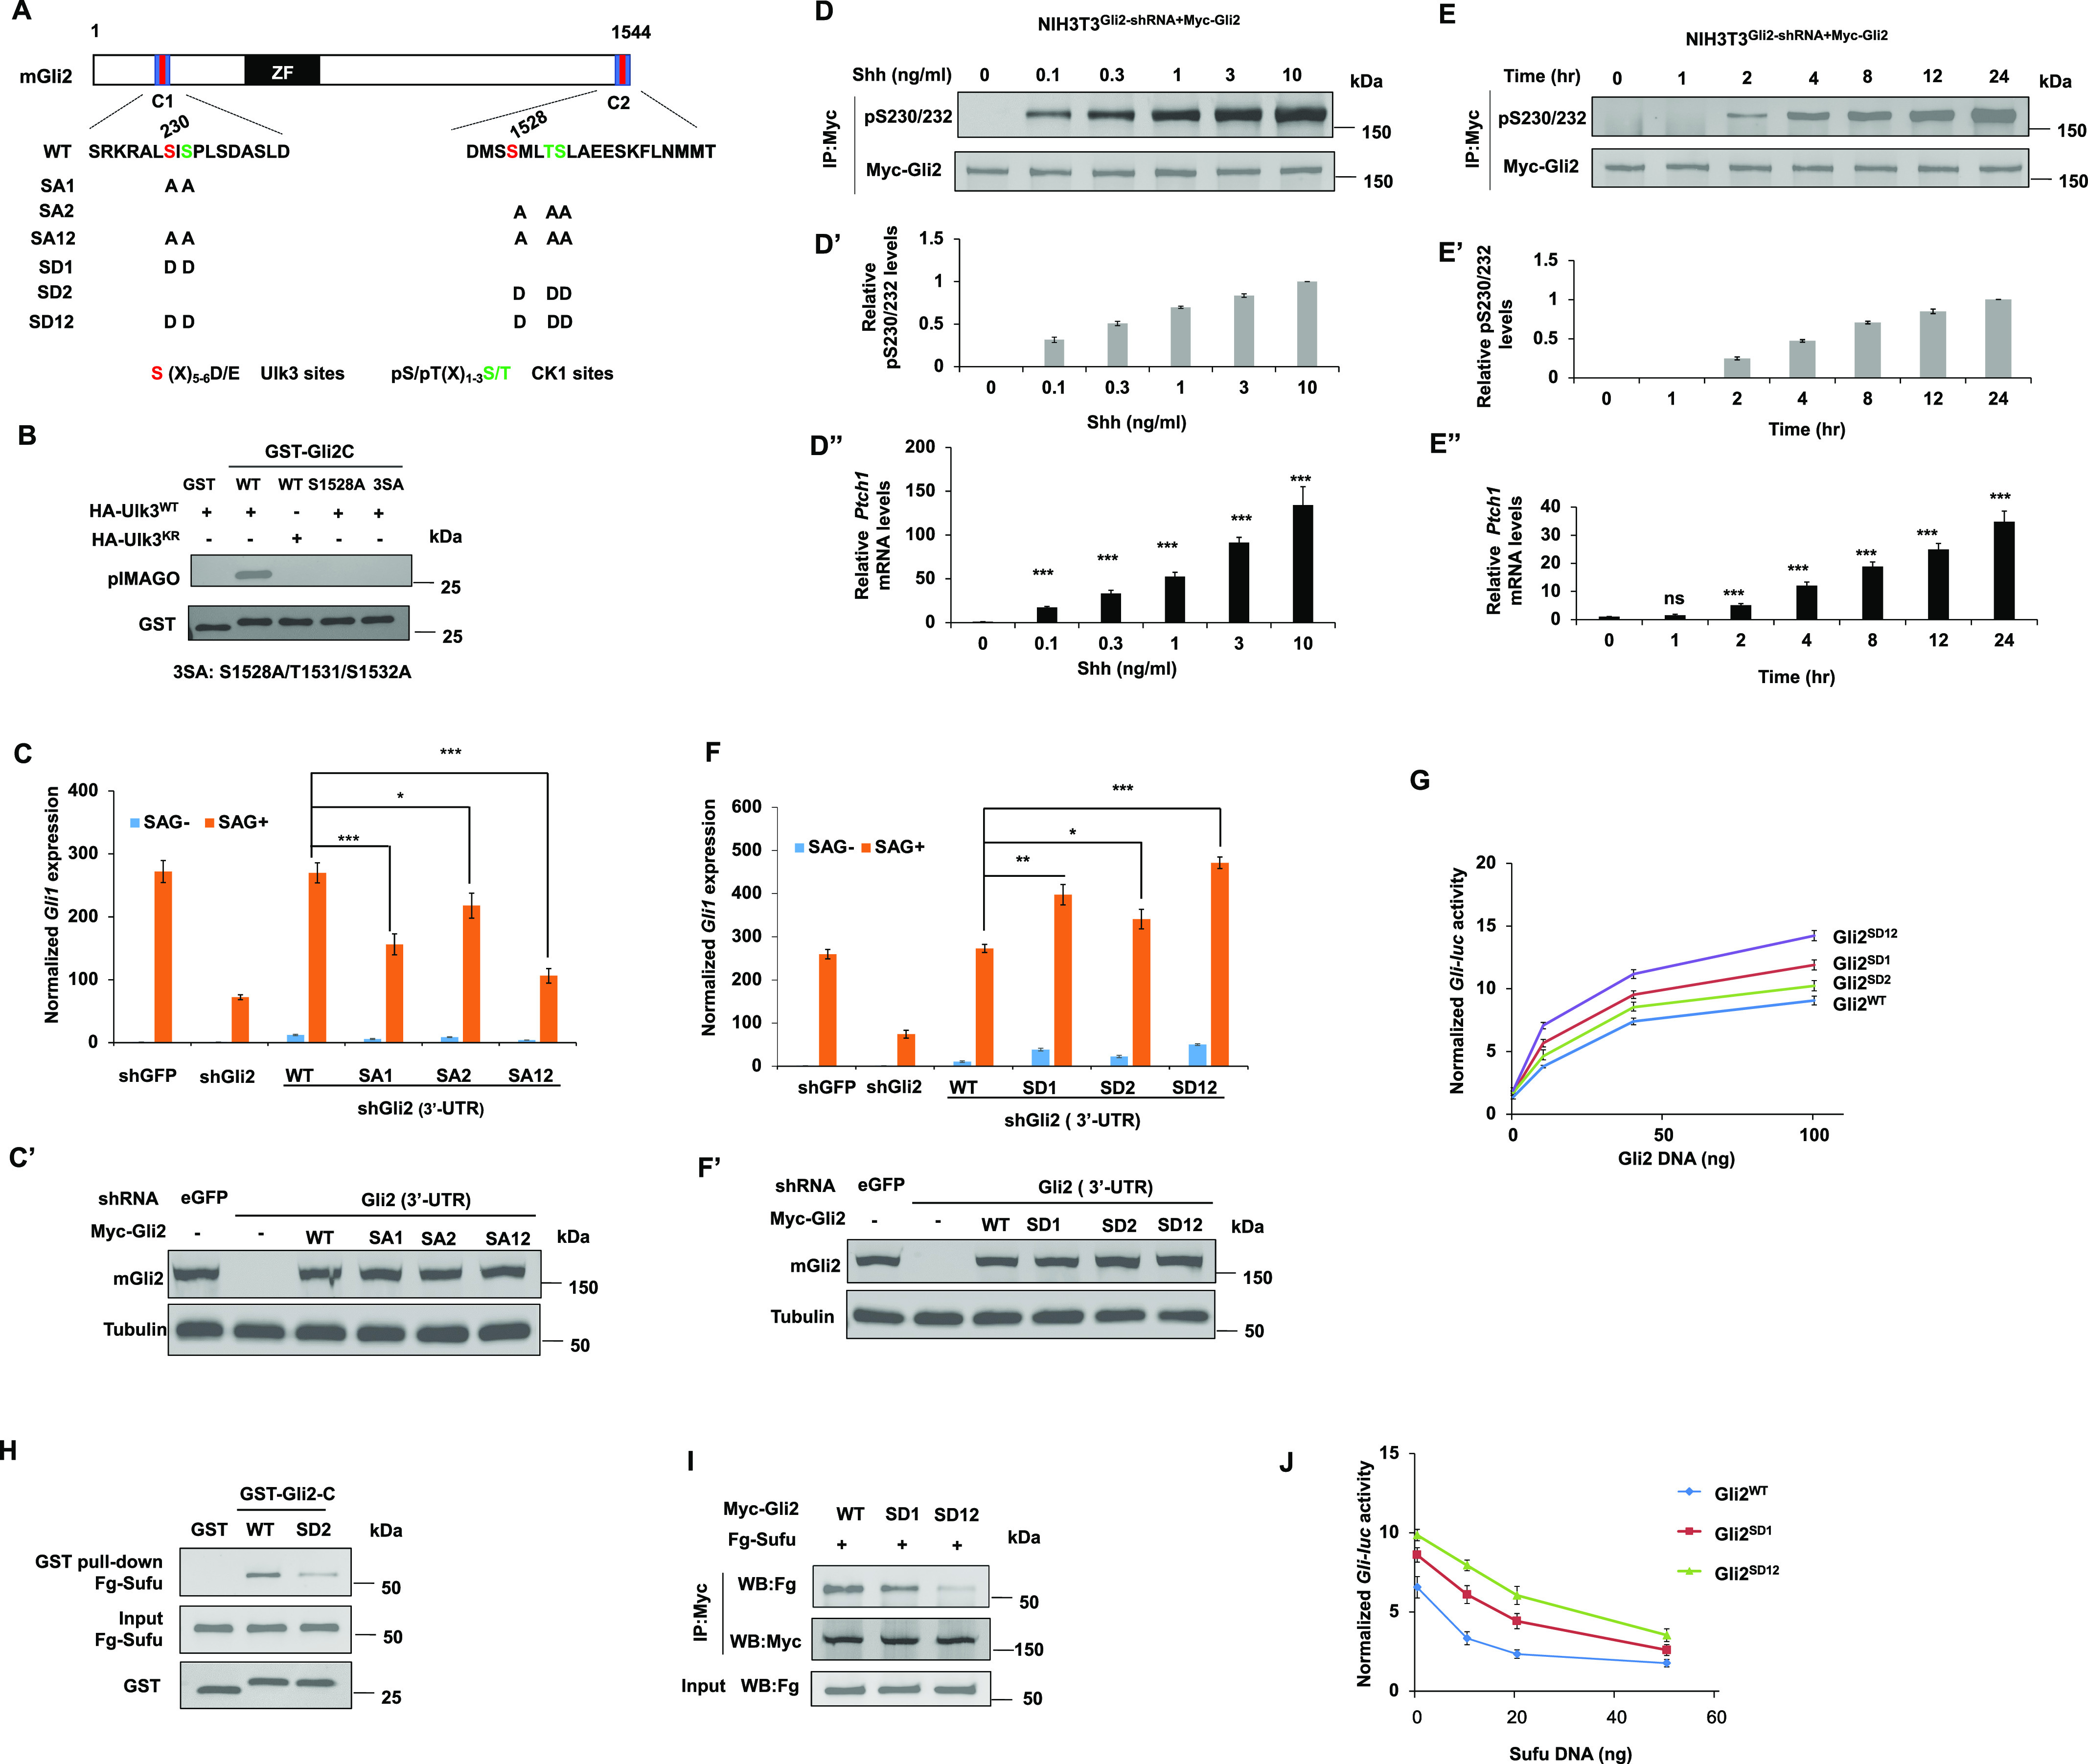
Figure 4. Multisite phosphorylation of Gli2 promotes its activation.

(A) Schematic diagram of mouse Gli2 with primary sequences of the three phosphorylation clusters shown underneath. Ulk3 and CK1 sites are color-coded in “red” and “green,” respectively. Amino acid substitutions for individual Gli2 constructs are indicated. (B) In vitro kinase assay using immunopurified HA-Ulk3WT or HA-Ulk3KR as kinase and the indicated GST-fusion proteins as substrates. Phosphorylation was detected by pIMAGO. (C, C’, F, F’) Relative Gli1 mRNA expression (C, F) or Gli2 protein levels (C’ and F’) in NIH3T3 cells expressing the indicated shRNA and Myc-Gli2WT or its variants with or without SAG. (D, D’, D”, E, E’, E”) Western blot analysis of Myc-Gli2 phosphorylation on S230/232 in NIH3T3 cells infected with lentivirus expressing shRNA targeting the 3′ UTR of Gli2 and lentivirus expressing Myc-Gli2WT (NIH3T3Gli2-shRNA/Myc-Gli2) in the presence of increasing amounts of Shh-N for 24 h (D) or exposed to a fixed amount of Shh-N (1 ng/ml) for increasing amounts of time (E). Quantification of pS230/232 signals (D’, E’) or Ptch1 mRNA (D”, E”) under these conditions. (G, J) Gli-luc reporter activity in NIH3T3 cells transfected with increasing amounts of the indicated Gli2 constructs (G) or fixed amount of the indicated Gli2 constructs and increasing amounts of Sufu constructs (J). (H) Western blot analysis of Fg-Sufu pulled down by the indicated GST fusion proteins from HEK293T cells expressing a Fg-Sufu construct. (I) Western blot analysis of Flag-Sufu coimmunoprecipitated with Myc-Gli2WT, Myc-Gli2SD1, and Myc-Gli2SD12. Data are mean ± SD from three independent experiments. *P < 0.05, **P < 0.01, and ***P < 0.001 (t test).
