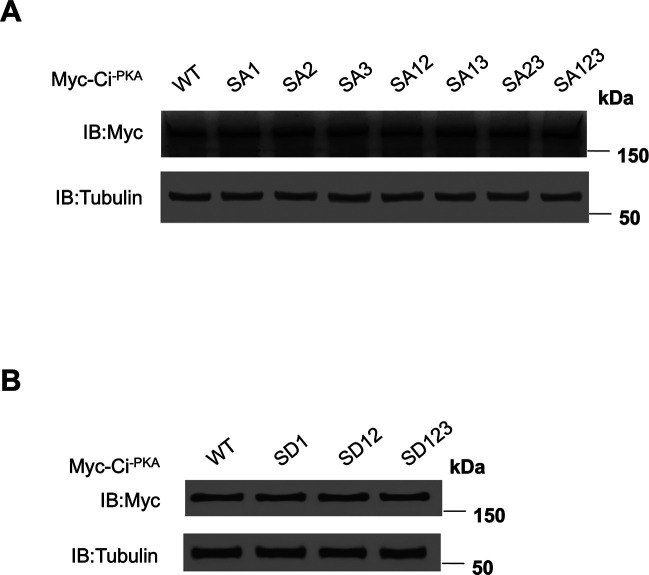
Figure S2. Expression levels of Ci variants in S2R+ cells.
(A, B) Western blot analysis of protein expression levels of the indicated phosphorylation deficient (A) or phosphorylation-mimetic (B) Ci variants transfected into S2R+ cells indicated that these Ci constructs were expressed at similar levels.

