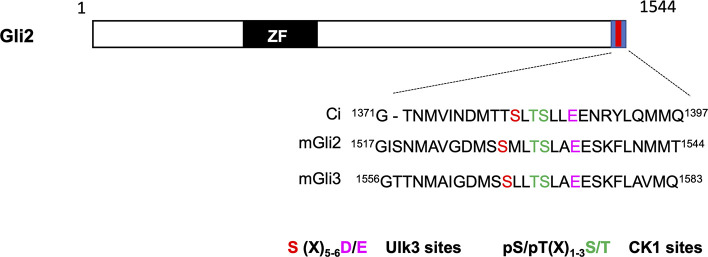
Figure S4. The C-terminal phosphorylation cluster is conserved in Gli2 and Gli3.
Alignment of the C-terminal sequence from Ci (aa1371-1397), mouse Gli2 (aa1517-1544), and mouse Gli3 (aa1556-1583). Ulk3 and CK1 sites are color-coded in “red” and “green,” respectively. The acidic residues at +6/7 position of Ulk3 site is indicated in magenta.

