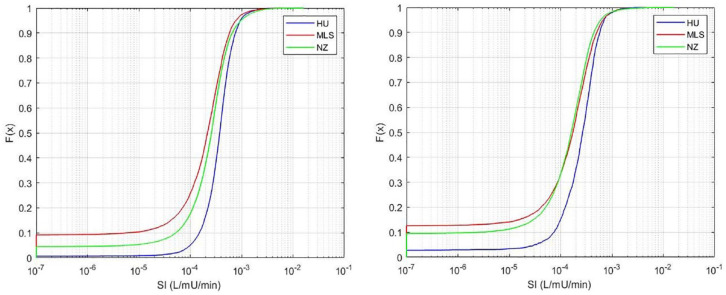
Figure 4.
Distribution of identified SI for each cohort using the standard, fixed value for EPG of 1.16 mmol/min. On the left, all patients (N = 717), and on the right, only patients with SI constrained to the minimum value for at least 1 hour (N = 330). The proportion of values at the lower limit of SI = 1e-7 L/mU/min in Table 3 match the starting points in this figure (left). Note that the x-axis is a log scale.

