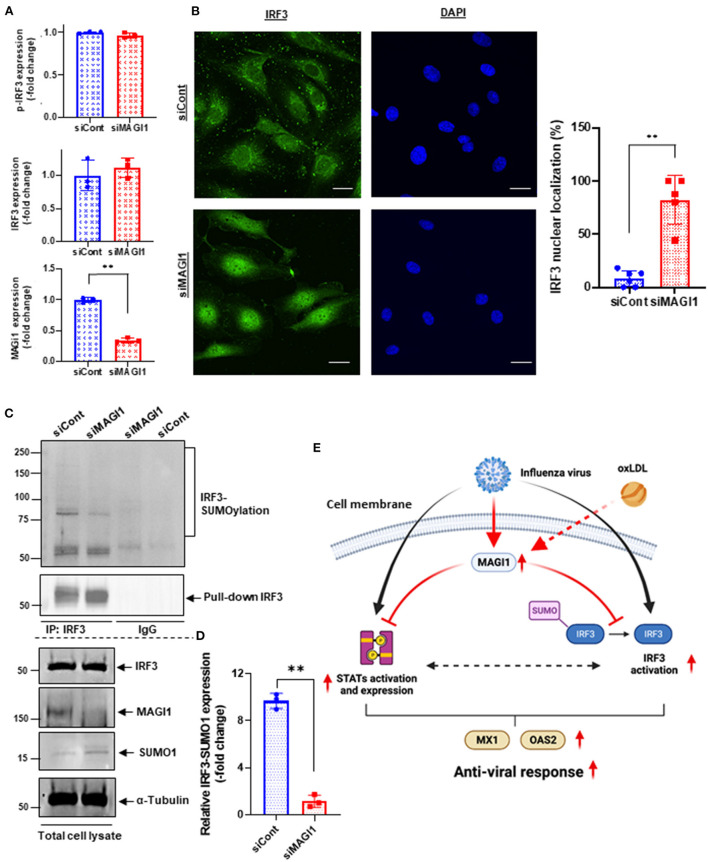
Figure 7.
MAGI1 depletion promotes IRF3 nuclear translocation and de-SUMOylation without affecting IRF3 S396 phosphorylation. (A) HUVECs were transfected with either siCont or siMAGI1. After 48 h of transfection, cell lysates were analyzed by immunoblotting with each specific antibody as indicated. The graphs represent densitometry data from 3 independent gels, one of which is shown in Figure 5C. Each group passed the Shapiro-Wilk normality test, then an unpaired student t-test was performed using the Prism software (GraphPad Software). The graphs show mean ± SD, n = 3, **P < 0.01. (B) HUVECs were transfected with either siCont or siMAGI1. After 48 h of transfection, immunofluorescence staining for IRF3 protein (green) and DAPI staining for the nuclei (blue) were performed. Scale bars: 20 μM. Robust IRF3 nuclear translocation noted in siMAGI1-transfected cells. The percentages of cells with nuclear staining were quantified by counting the cells with the mean intensity of IRF3 staining in the nucleus ≥ mean intensity of IRF3 cytoplasmic staining by each dish (n = 5–6) in a blinded manner. (C) HUVECs were transfected with either siCont or siMAGI1. After 48 h of transfection, cell lysates were immuno-precipitated IRF3 with the antibody that specifically recognizes this protein then immunoblotting with the antibody that recognizes SUMO1 to detect IRF3 SUMOylation (20). IgG antibody was used as a negative control. Total cell lysates were immunoblotted with each specific antibody as indicated. (D) The graphs represent densitometry data from 3 independent gels, one of which is shown in shown in (C). Median intensities of IRF3 SUMOylation were calculated after subtracting the background, which is median intensities of IgG control. Each group passed the Shapiro-Wilk normality test, then an unpaired student t-test with Welch's correction was performed using the Prism software (GraphPad Software). The graph shows mean ± SD, n = 3, **P < 0.01. (E) The scheme depicts the relationship between MAGI1 and IFN signaling. IAV infection induces anti-viral responses including STATs and IRF3 activation and subsequent MX1 and OAS2 induction. For efficient infection of IAV to ECs, IAV induces MAGI1 expression, resulting in inhibition of anti-viral responses by inhibiting STATs and IRF3 activation. Especially, MAGI1 inhibits IRF3 de-SUMOylation and subsequent IRF3 activation. Importantly, OxLDL also upregulates MAGI1 expression and promotes IAV infection, which may explain the relationship between hypercholesterolemia and IAV infection in patients. The scheme was generated using BioRender.

