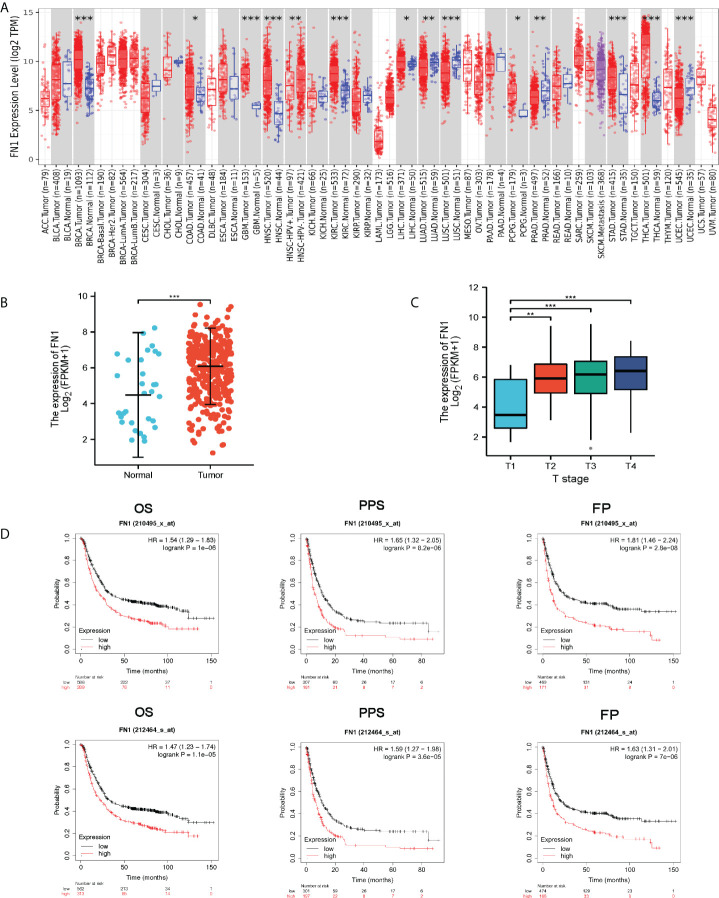
Figure 1.
FN1 expression levels in different types of human cancers. (A) Human FN1 expression levels in different tumor types from TCGA database were determined by TIMER (*p < 0.05, **p < 0.01, ***p < 0.001). (B) FN1 mRNA expression in STAD tissues and normal tissues (N = 32; T = 375). (C) Association of FN1 expression with T stage. (D) OS, FP, and PPS survival curves of gastric cancer. OS, overall survival; FP, first progression; DFS, Disease free survival.

