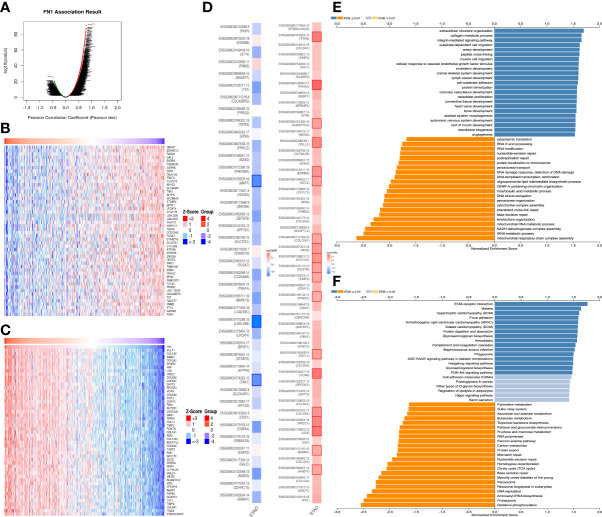
Figure 3.
The coexpression genes with FN1 in STAD from the LinkedOmics database. (A) The whole significantly associated genes with FN1 distinguished by Pearson test in the STAD cohort. (B, C) Top 50 genes positively and negatively related to FN1 in STAD showed, respectively, by heat maps. Red represents positively linked genes, and blue represents negatively linked genes. (D) Survival map of the top 50 genes positively and negatively associated with FN1 in STAD. (E, F) KEGG pathways and GO annotations of FN1 in the STAD cohort.

