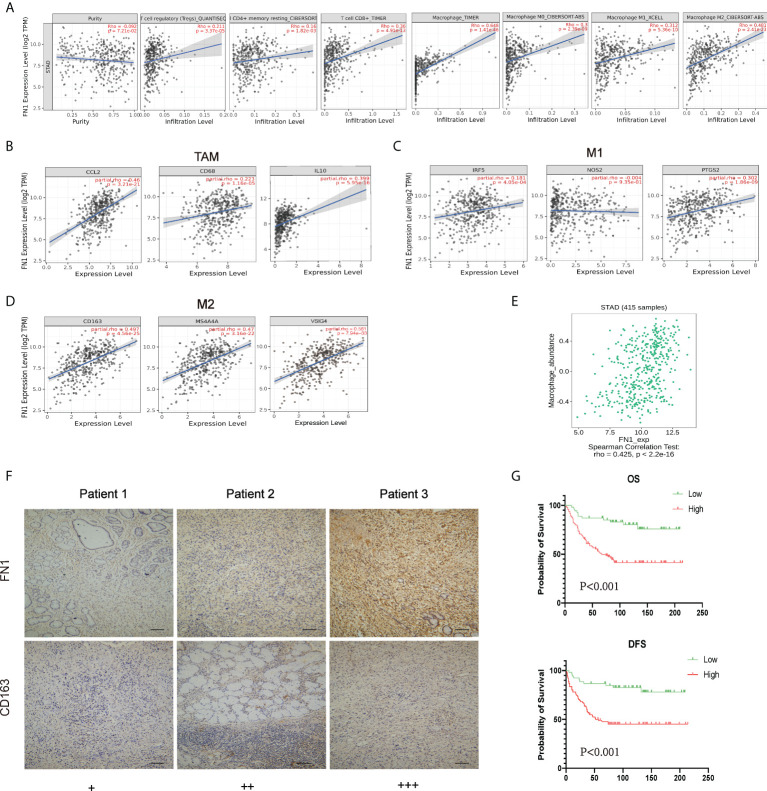
Figure 7.
Correlation analysis between FN1 and related genes and markers of macrophages. (A) FN1 expression is negatively related to tumor purity and has significant positive correlations with infiltrating levels of Tregs, CD4+ T cells, CD8+ T cells, and macrophages in STAD. (B–D) Scatterplots of correlations between FN1 expression and gene markers of macrophages, TAMs (B), and M1 (C) and M2 macrophages (D) in STAD. (E) Correlation between FN1 expression and Macrophage in gastric cancer available at the TISIDB database. Color images are available online (n = 415). (F) Correlation between FN1 expression and CD163 in gastric cancer. Gastric cancer tissue was quantitated by scoring staining intensity, including negative (–) and weak (+) staining, moderate (++) and strong (+ + +) staining, respectively. Scale bar = 100 μm. (G) OS and DFS analysis of FN1 in STAD.

