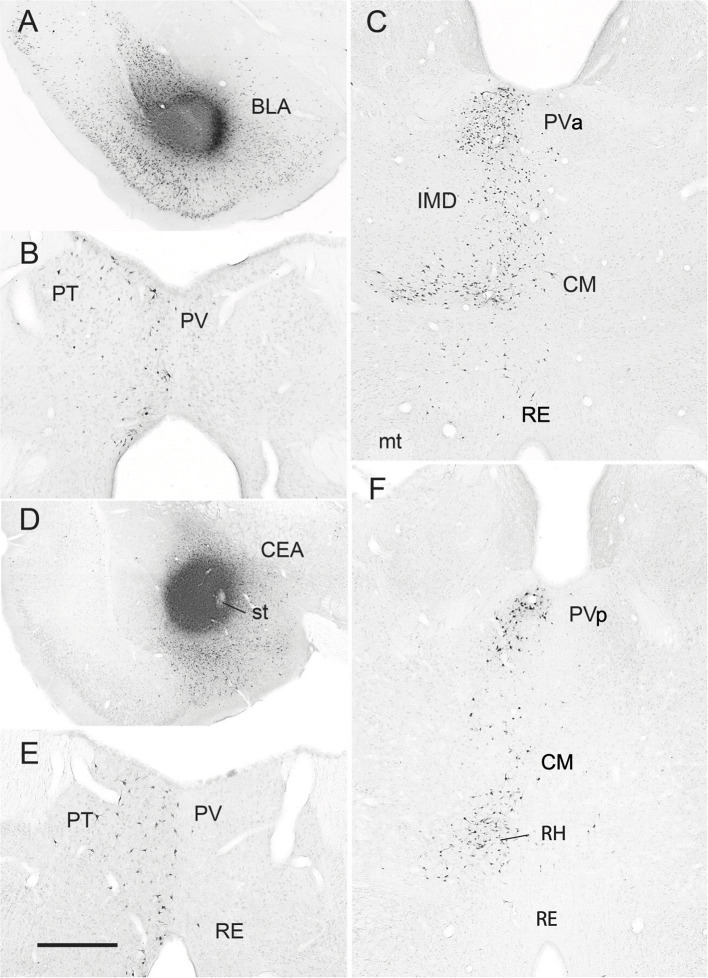
Figure 7.
(A–C) Low-magnification bright-field micrographs of transverse sections through the forebrain depicting the site of a retrograde tracer (FluoroGold) injection in the basolateral nucleus (BLA) of the amygdala of the rat (A) and patterns of retrogradely labeled cells in the anterior paraventricular (PV) and paratenial (PT) nuclei of dorsal midline thalamus (B) and the posterior PV and central medial (CM) nuclei of the rostral intralaminar thalamus (C) produced by this injection. Note the significant numbers of retrogradely labeled neurons in the posterior PV and CM (C), but fewer in the anterior PV, PT and nucleus reuniens (RE) (B,C) with this injection. (D–F) Low-magnification bright-field micrographs of transverse sections through the forebrain depicting the site of a retrograde tracer injection in the central nucleus (CEA) of the amygdala (D) and patterns of retrogradely labeled cells in the anterior PV, PT and RE nuclei of thalamus (E) and the posterior PV, CM and rhomboid (RH) nuclei of the thalamus (F) produced by this injection. Note moderate numbers of labeled cells in RE (E), PT (E), CM (F) and the anterior PV (E), but much denser clusters of cells in the posterior PV (F) and RH (F). IMD, interomediodorsal nucleus of thalamus, mt, mammillothalamic tract; PVa, anterior paraventricular nucleus of thalamus; PVp posterior paraventricular nucleus of thalamus; st, stria terminalis. Scale bar for (A) = 750 μm; for (B) = 300 μm; for (C) =500 μm; for (D) =700 μm; for (E) = 400 μm; for (F) = 450 μm. Modified from Vertes and Hoover (2008).

