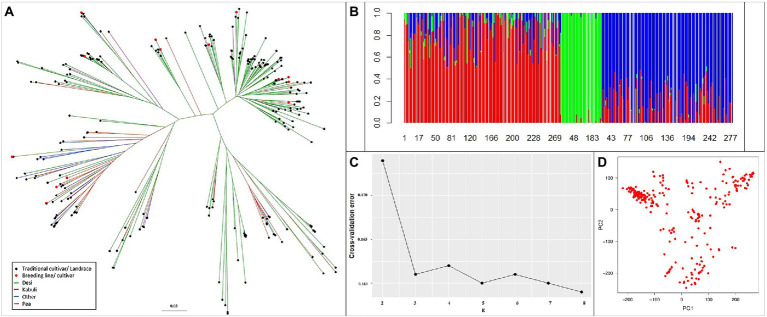
Figure 4.
Genetic relatedness and population structure of the reference set. (A) Diversity using unweighted neighbor-joining tree method. (B) Ancestry proportions from ADMIXTURE analysis (k = 3), optimal with lowest cross-validation error. Each colored vertical line indicates the proportion of ancestral population (k) for each accession. The numbers on X-axis represent the reference set accessions. (C) Cross-validation error for k = 2–8 from ADMIXTURE analysis. (D) Variation depicted as PCA plot. Clustering pattern independent of biological status and seed type.

