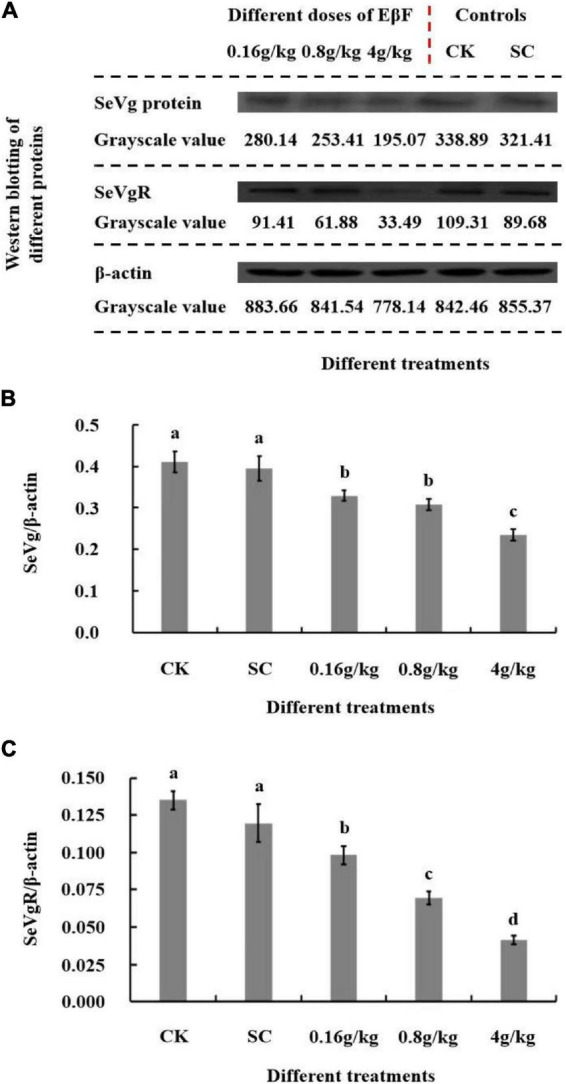
FIGURE 5.

The Western blot assay showed the relative expressions of SeVg and SeVgR proteins in female adults of S. exigua after EβF treatments at different doses. (A) The Western blot pictures of SeVg and SeVgR proteins in female adults of S. exigua after EβF treatments at different doses. (B,C) The relative expressions of SeVg and SeVgR protein expressions by calculating the grayscale value ratios of SeVg/β-actin and SeVgR/β-actin with different treatments. CK (blank control) and SC (solvent control) were set as controls. The concentrations of EβF treatments were set as 0.16, 0.8, and 4 g/kg; the units of g/kg in all treatment groups mean the mass ratio of EβF/artificial diet. Different lower-case letters indicated a significant difference determined by performing ANOVA, followed by Tukey’s HSD test (p < 0.05).
