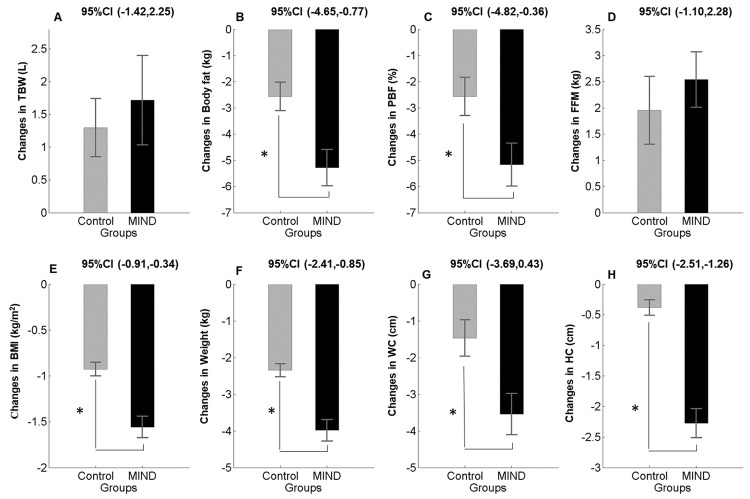
Figure 2.
Anthropometric changes were determined (Mean±SEM) in the MIND diet group (black color) and control group (gray color) at baseline and follow-up. Note that P<0.05 in a repeated measure ANOVA test indicating significant improvement in Body Mass Index, weight, waist circumference (2E, 2F, and 2G) and percent of body fat (2C), as well as hip circumference (2H) in the MIND diet group, in comparison with the control group. TBW: Total body water; PBF: Percent of body fat; FFM: Fat-free mass; BMI: Body mass index; WC: Waist circumferences; HC: Hip circumferences

