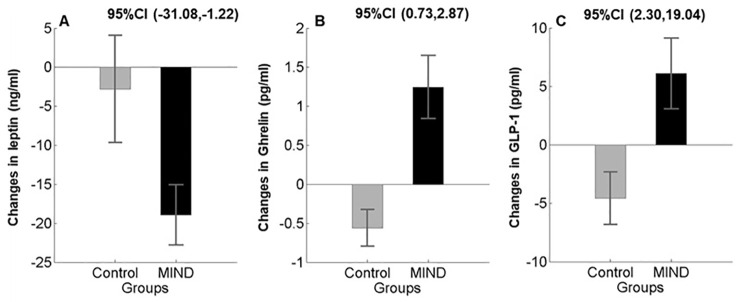
Figure 3.
Changes in metabolic profile were determined (Mean±SEM) in the MIND diet group (black color) and control group (gray color) at baseline and follow-up. Note that the MIND diet group indicated improvement in plasma levels of Leptin, Ghrelin, and GLP-1 (3A, 3B, 3D, and 3C) than the control group in a repeated measure group×time interaction ANOVA. MIND: Mediterranean-DASH Intervention for Neurodegenerative Delay, GLP-1: Glucagon-Like Peptide 1.

