
Figure 1.
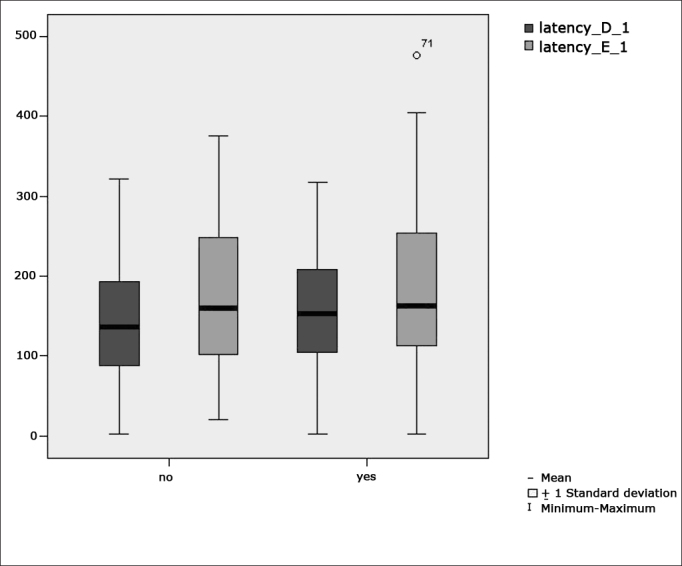
Box plot for right and left calibration eye-motor parameter (latency) per group. (Student”s t-test controlled by Lavene”s test for Equality of Variances between the means of parametric variables of interest).
Official websites use .gov
A
.gov website belongs to an official
government organization in the United States.
Secure .gov websites use HTTPS
A lock (
) or https:// means you've safely
connected to the .gov website. Share sensitive
information only on official, secure websites.
Box plot for right and left calibration eye-motor parameter (latency) per group. (Student”s t-test controlled by Lavene”s test for Equality of Variances between the means of parametric variables of interest).