
Figure 10.
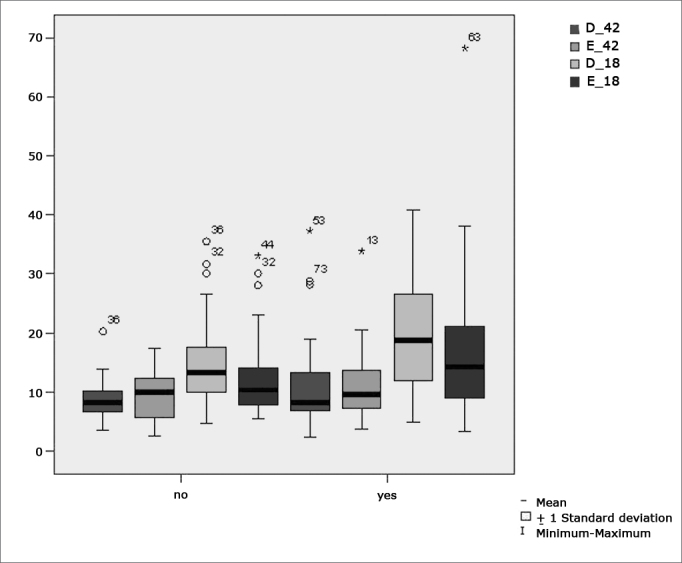
Box plot for right and left caloric tests (CT) at 18ºC and 42ºC per group. (Student”s t-test controlled by Lavene”s test for Equality of Variances between the means of parametric variables of interest).
Official websites use .gov
A
.gov website belongs to an official
government organization in the United States.
Secure .gov websites use HTTPS
A lock (
) or https:// means you've safely
connected to the .gov website. Share sensitive
information only on official, secure websites.
Box plot for right and left caloric tests (CT) at 18ºC and 42ºC per group. (Student”s t-test controlled by Lavene”s test for Equality of Variances between the means of parametric variables of interest).