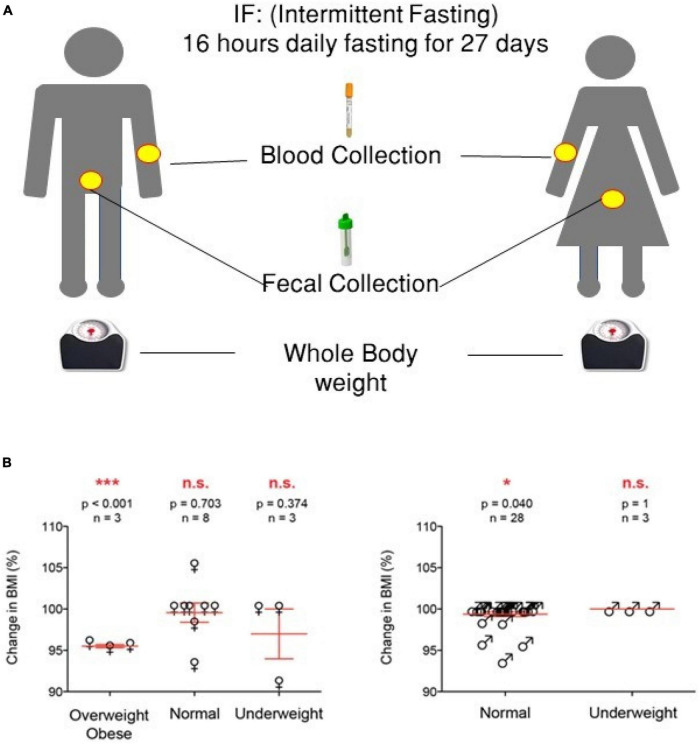
FIGURE 1.
Experimental design of the study and summary of the anthropometric results. (A) Experimental design. (B) Summary of the anthropometric values [one-way ANOVA was used, highly significant (p < 0.01) and significant (p < 0.05) values are presented with *** and *, respectively, while non-significant values are presented by N.S].

