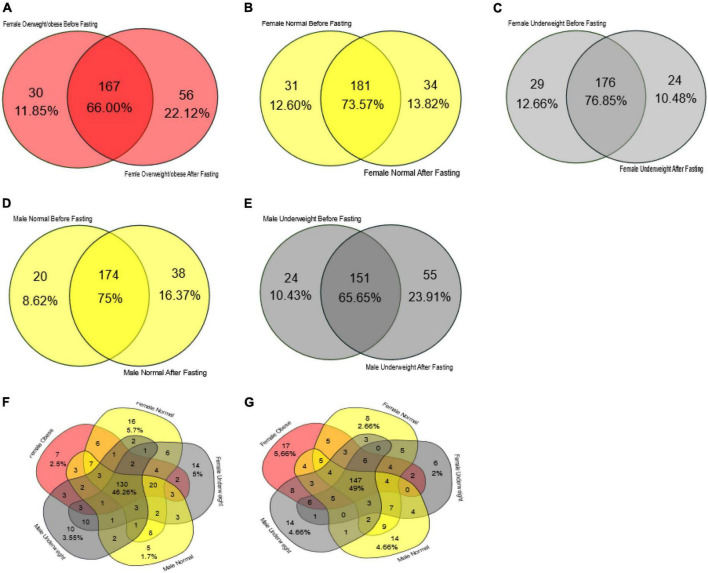
FIGURE 7.
Venn diagram representing core unique and shared intestinal microbiota of female and male volunteers in response to intermittent fasting. (A) Obese/overweight female volunteers, (B) normal female volunteers, (C) underweight female volunteers, (D) male normal volunteers, (E) male underweight volunteers, (F) all volunteers before intermittent fasting, and (G) all volunteers after fasting.

