
Figure 6.
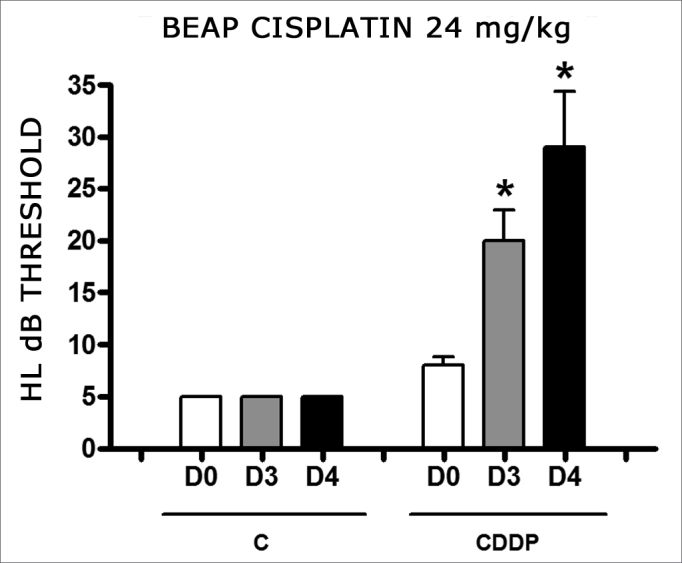
Graph showing the mean I-V interval of the animals in groups 9 and 10 at days D0, D3 and D4 expressed as mean and mean standard error (MED and [IEY1] EPM). We did not find statistical difference between days in the two groups. ANOVA p > 0.05.